Engage NY Eureka Math 7th Grade Module 5 Lesson 15 Answer Key
Eureka Math Grade 7 Module 5 Lesson 15 Exercise Answer Key
Exercises 1–5: Sampling Pennies
Exercise 1.
Do you think different random samples from the same population will be fairly similar? Explain your reasoning.
Answer:
Most of the samples will probably be about the same because they come from the same distribution of pennies in the jar. They are random samples, so we expect them to be representative of the population.
Exercise 2.
The plot below shows the number of years since being minted (the penny age) for 150 pennies that JJ had collected over the past year. Describe the shape, center, and spread of the distribution.
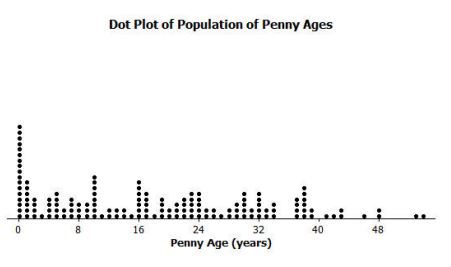
Answer:
The distribution is skewed with many of the pennies minted fairly recently. The minimum is 0, and the maximum is about 54 years since the penny was minted. Thinking about the mean as a balance point, the mean number of years since a penny in this population was minted seems like it would be about 18 years.
Exercise 3.
Place ten dots on the number line that you think might be the distribution of a sample of 10 pennies from the jar.
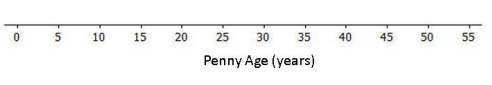
Answer:
Answers will vary. Most of the ages in the sample will be between 0 and 25 years. The maximum might be somewhere between 40 and 54.
Exercise 4.
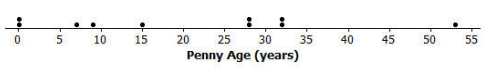
Select a random sample of 10 pennies, and make a dot plot of the ages. Describe the distribution of the penny ages in your sample. How does it compare to the population distribution?
Answer:
Answers will vary. Sample response: The median is about 21 years. Two of the pennies were brand new, and one was about 54 years old. The distribution was not as skewed as I thought it would be based on the population distribution.
Exercise 5.
Compare your sample distribution to the sample distributions on the board.
a. What do you observe?
b. How does your sample distribution compare to those on the board?
Answer:
a. Answers will vary. Sample response: Most of them seem to have the same minimum, 0 years, but the maximums vary from about 35 to 54 years. Overall, the samples look fairly different: One median is at 25, but several are less than 10. All but two of the distributions seem to be skewed like the population (i.e., with more of the years closer to 0 than to the larger number of years).
b. Answers will vary. Sample response: It is pretty much the same as Sample 3, with some values at 0, and the maximum is 45 years. The median is around 25 years.
Exercises 6–9: Grocery Prices and Rounding
Exercise 6.
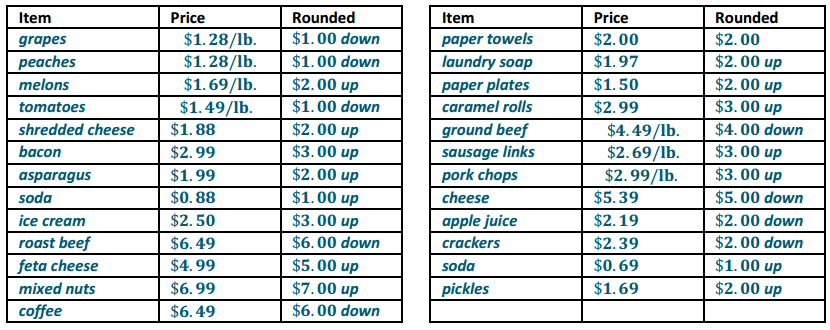
Look over some of the grocery prices for this activity. Consider the following statistical question: “Do the store owners price the merchandise with cents that are closer to a higher dollar value or a lower dollar value?” Describe a plan that might answer that question that does not involve working with all 100 items.
Answer:
Sample response: I would place all of the items in a bag. The prices in the bag represent the population. I would begin by selecting items from the bag and record the prices of each item I select. I would get a sample of at least
10 items.
Exercise 7.
Do the store owners price the merchandise with cents that are closer to a higher dollar value or a lower dollar value? To investigate this question in one situation, you will look at some grocery prices in weekly flyers and advertising for local grocery stores.
a. How would you round $3.49 and $4.99 to the nearest dollar?
b. If the advertised price was three for $4.35, how much would you expect to pay for one item?
c. Do you think more grocery prices will round up or round down? Explain your thinking.
Answer:
a. $3.49 would round to $3.00, and $4.99 would round to $5.00.
b. $1.45.
c. Sample response: Prices such as $3.95 or $1.59 are probably chosen because people might focus on the dollar portion of the price and consider the prices to be lower than they actually are when really the prices are closer to the next higher dollar amount.
Exercise 8.
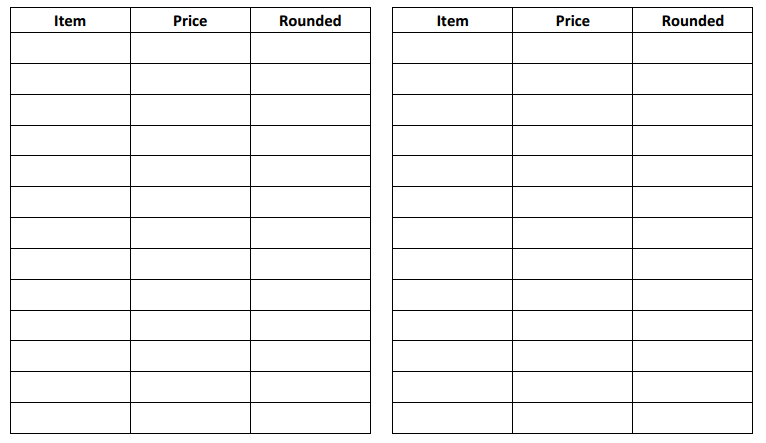
Follow your teacher’s instructions to cut out the items and their prices from the weekly flyers and put them in a bag. Select a random sample of 25 items without replacement, and record the items and their prices in the table below.
Answer:
(Possible responses are shown in the table.)
Example of chart suggested:
Exercise 9.
Round each of the prices in your sample to the nearest dollar, and count the number of times you rounded up and the number of times you rounded down.
a. Given the results of your sample, how would you answer the question: Are grocery prices in the weekly ads at the local grocery closer to a higher dollar value or a lower dollar value?
b. Share your results with classmates who used the same flyer or ads. Looking at the results of several different samples, how would you answer the question in part (a)?
c. Identify the population, sample, and sample statistic used to answer the statistical question.
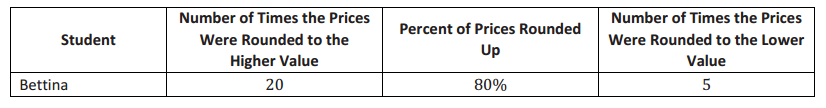
d. Bettina says that over half of all the prices in the grocery store will round up. What would you say to her?
Answer:
a. Answers will vary. Sample response: In our sample, we found 16 out of 25, or 64%, of the prices rounded to the higher value, so the evidence seems to suggest that more prices are set to round to a higher dollar amount than to a lower dollar amount.
b. Answers will vary. Sample response: Different samples had between 54% and 70% of the prices rounded to a higher value, so they all seem to support the notion that the prices typically are not set to round to a lower dollar amount.
c. Answers will vary. Sample response: The population was the set of all items in the grocery store flyer or ads that we cut up and put in the bag, the sample was the set of items we drew out of the bag, and the sample statistic was the percent of the prices that would be rounded up.
d. Answers will vary. Sample response: While she might be right, we cannot tell from our work. The population we used was the prices in the ad or flyer. These may be typical of all of the store prices, but we do not know because we never looked at those prices.
Eureka Math Grade 7 Module 5 Lesson 15 Problem Set Answer Key
Question 1.
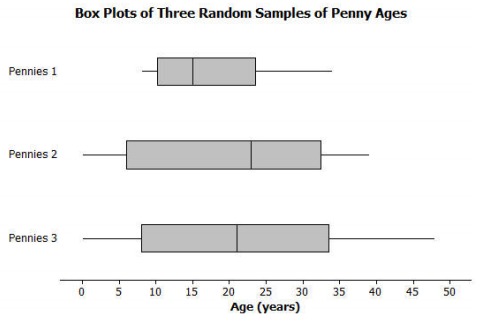
Look at the distribution of years since the pennies were minted from Example 1. Which of the following box plots seem like they might not have come from a random sample from that distribution? Explain your thinking.
Answer:
Sample response: Given that the original distribution had a lot of ages that were very small, the Pennies 1 sample seems like it might not come from that population. The middle half of the ages are close together with a small interquartile range (about 12 years). The other two samples both have small values and a much larger IQR than the Pennies 1 sample, which both seem more likely to happen in a random sample given the spread of the original data.
Question 2.
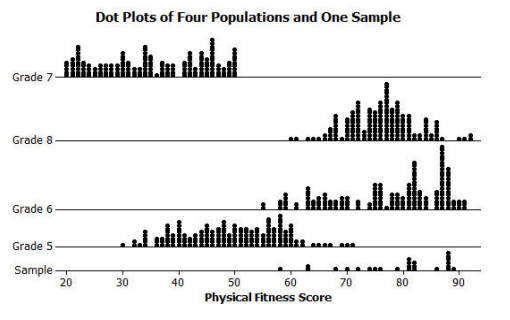
Given the following sample of scores on a physical fitness test, from which of the following populations might the sample have been chosen? Explain your reasoning.
Answer:
Sample response: These sample values were not in Grades 5 or 7, so the sample could not have come from those grades. It could have come from either of the other two grades (Grades 6 or 8). The sample distribution looks skewed like Grade 6, but the sample size is too small to be sure.
Question 3.
Consider the distribution below:
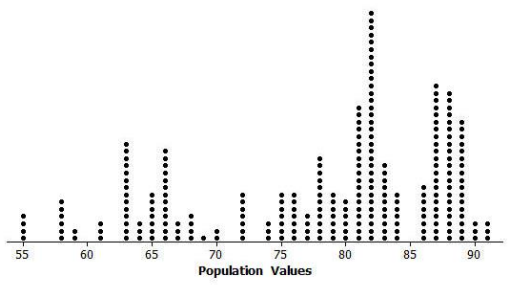
a. What would you expect the distribution of a random sample of size 10 from this population to look like?
b. Random samples of different sizes that were selected from the population in part (a) are displayed below. How did your answer to part (a) compare to these samples of size 10?
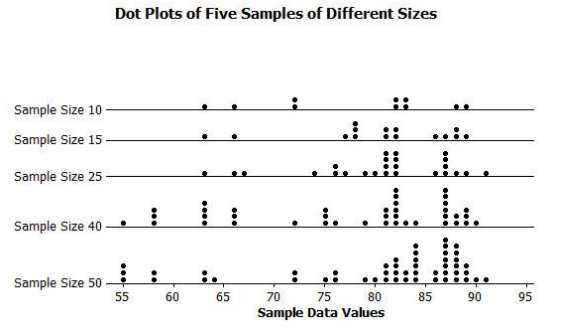
c. Why is it reasonable to think that these samples could have come from the above population?
d. What do you observe about the sample distributions as the sample size increases?
Answer:
a. Sample response: The samples will probably have at least one or two elements between 80 and 90 and might go as low as 60. The samples will vary a lot, so it is hard to tell.
b. Sample response: My description was pretty close.
c. Sample response: Each of the samples is centered about where the population is centered, although this is easier to see with a larger sample size. The spread of each sample also looks like the spread of the population.
d. Sample response: As the sample size increases, the sample distribution more closely resembles the population distribution.
Question 4.
Based on your random sample of prices from Exercise 6, answer the following questions:
a. It looks like a lot of the prices end in 9. Do your sample results support that claim? Why or why not?
b. What is the typical price of the items in your sample? Explain how you found the price and why you chose that method.
Answer:
a. Sample response: Using the prices in the random sample, about 84% of them end in a 9. The results seem to support the claim.
b. Sample response: The mean price is $2.50, and the median price is $2.00. The distribution of prices seems slightly skewed to the right, so I would probably prefer the median as a measure of the typical price for the items advertised.
Question 5.
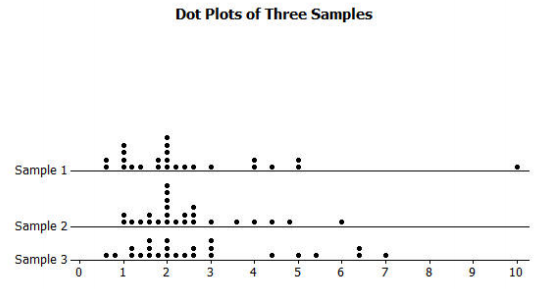
The sample distributions of prices for three different random samples of 25 items from a grocery store are shown below.
a. How do the distributions compare?
b. Thomas says that if he counts the items in his cart at that grocery store and multiplies by $2.00, he will have a pretty good estimate of how much he will have to pay. What do you think of his strategy?
Answer:
a. Sample response: The samples are slightly skewed right. They all seem to have a mean around $2.50 and a median around $2.00. Sample 1 has one item that costs a lot more than the others. Most of the prices vary from a bit less than $1.00 to around $5.00.
b. Answers will vary. Sample response: Looking at the three distributions, $2.00 is about the median, so half of the items cost less than $2.00, and half cost more, but that does not tell how much they cost. The mean would be a better estimate of the total cost because the mean is calculated in a way that is similar to how Thomas wants to estimate the total cost. In this case, the mean (or balance point) of the distributions looks like it is about $2.50, so he would have a better estimate of the total cost if he multiplied the number of items by $2.50.
Eureka Math Grade 7 Module 5 Lesson 15 Exit Ticket Answer Key
Identify each as true or false. Explain your reasoning in each case.
Question 1.
The values of a sample statistic for different random samples of the same size from the same population will be the same.
Answer:
False. By chance, the samples will have different elements, so the values of the summary statistics may be different.
Question 2.
Random samples from the same population will vary from sample to sample.
Answer:
True. Each element has the same chance of being selected, and you cannot tell which ones will be chosen; it could be any combination.
Question 3.
If a random sample is chosen from a population that has a large cluster of points at the maximum, the sample is likely to have at least one element near the maximum.
Answer:
True. If many of the elements are near the same value, it seems the chance of getting one of those elements in a random sample would be high.