Engage NY Eureka Math Algebra 1 Module 4 Lesson 22 Answer Key
Eureka Math Algebra 1 Module 4 Lesson 22 Exploratory Challenge Answer Key
Exploratory Challenges 1–3
Solve each problem, and show or explain how you found your answers.
Question 1.
Xavier and Sherleese each threw a baseball straight up into the air. The relationship between the height (distance from the ground in feet) of Sherleese’s ball with respect to the time since it was thrown, in seconds, is given by the function:
S(t) = – 16t2 + 79t + 6.
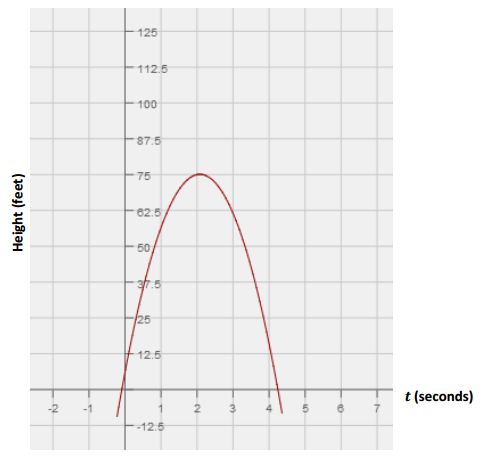
The graph of the height as a function of time of Xavier’s ball is represented below.
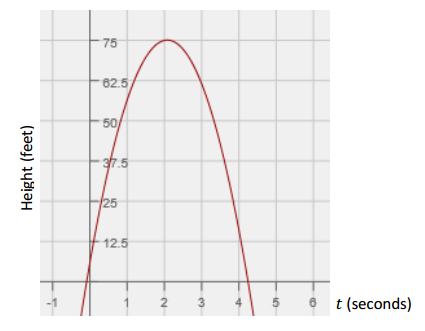
Xavier claims that his ball went higher than Sherleese’s. Sherleese disagrees. Answer the questions below, and support your answers mathematically by comparing the features found in the equation to those in the graph.
a. Who is right?
Answer:
Sherleese is right. Xavier’s baseball went 75 ft. at its highest point (based on the maximum point of the graph), which was lower than Sherleese’s. The maximum height of Sherleese’s ball is approximately 103.5 ft. This could be determined by completing the square, S(t) = – 16(t – \(\frac{79}{32}\))2 + 103.5, using the vertex formula to find the vertex, or using a table to approximate.
b. For how long was each baseball airborne?
Answer:
Sherleese’s baseball was airborne for approximately 5 sec.; the zeros of S are (5.01, 0) and ( – 0.07, 0). Since the ball lands on the ground at about 5 sec., that is approximately how long it was in flight. Xavier’s baseball was airborne for approximately 4.3 sec.
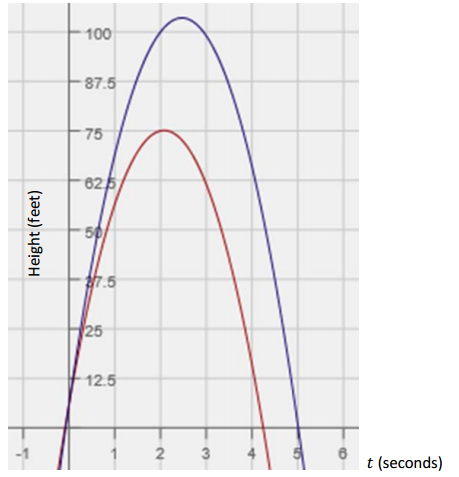
c. Construct a graph of Sherleese’s throw as a function of time (t) on the same set of axes as the graph of Xavier’s, and use the graph to support your answers to parts (a) and (b).
Answer:
In the graph below, you can see that Sherleese’s baseball clearly has a higher vertex. You can also read the t – axis to find the length of time each baseball was airborne (the distance between t = 0 and the positive t – intercept).
Question 2.
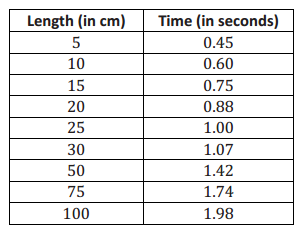
In science class, students constructed pendulums of various lengths and then recorded the time required for the pendulum to complete one full oscillation (out and back). The results are displayed in the table shown below.
a. Jack looks at the first three rows of the table and says that a linear function should be used to model the data. Based on the data, do you agree with him? Justify your reasoning.
Answer:
No, I do not agree with Jack. Looking at the first three rows, the data does appear to be linear because the average rate of change is the same for the intervals [5, 10] and [10, 15]. However, after that, the average rate of change does not remain constant; it decreases for each successive interval. This indicates that a linear model is not appropriate for the data.
b. Create a scatterplot of length versus oscillation time.

Answer:
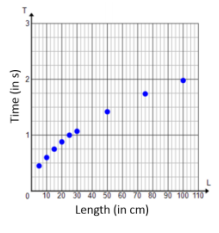
c. Based on the scatterplot, what sort of function might be used to model the data?
Answer:
It appears that the data could be modeled using a square root function or possibly a cube root function.
d. Mr. Williams, the science teacher, tells the students that the oscillation time for a pendulum can be found using the formula T = 2π\(\sqrt{\frac{L}{9.8}}\) where L is the length of the pendulum, in meters, and T is the oscillation time, in seconds. Does this formula support the results from the table?
Answer:
Yes. When values for L from the table are substituted into the formula, the values for T are approximately equal to the values in the table. For example, for a length of 25 cm, the oscillation time is approximately 1.0035 sec. (as shown in the calculation below), which is very close to the value recorded in the table (1.00).
L = 0.25→ T = 2π\(\sqrt{\frac{0.25}{9.8}}\)≈1.0035
c. Looking at the table of values, what effect does quadrupling the length of the pendulum have on the oscillation time? Use the formula from part (d) to demonstrate why this is the case.
Answer:
Quadrupling the length of the pendulum, doubles the oscillation time.
T = 2π\(\sqrt{\frac{4L}{9.8}}\) = 2π\(\sqrt{4 \cdot \frac{L}{9.8}}\) = 2π∙\(\sqrt{4}\)∙\(\sqrt{\frac{L}{9.8}}\) = 2(2π\(\sqrt{\frac{L}{9.8}}\))
Question 3.
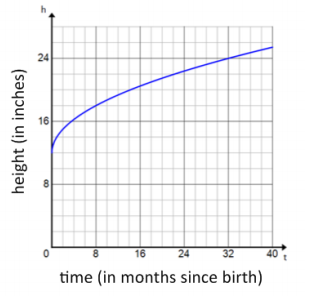
The growth of a Great Dane puppy can be represented by the graph below, where y represents the shoulder height (in inches) and x represents the puppy’s age (in months).
The growth of a lion cub can be modeled by the function represented in the table below.
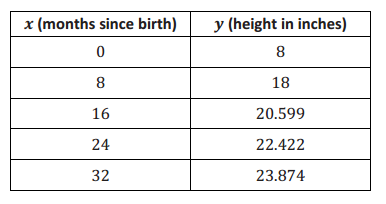
a. Which animal has the greater shoulder height at birth?
Answer:
The Great Dane has the taller shoulder height at birth, which is around 12 in. The lion cub has a shoulder height of only 8 in. at birth.
b. Which animal will have the greater shoulder height at 3 years of age (the age each animal is considered full – grown)?
Answer:
Estimating from the graph, the lion’s shoulder height at 36 months appears to be close to 25 in. Looking at the table of values, the average rate of change for each interval is decreasing. On the interval [24, 32], the average rate of change is 1.452. So on the interval [32, 36], the average rate of change should be less than 0.7. Therefore, I think the Great Dane’s height at 36 months will be closer to 4 in. than to 25 in., and the lion will have the greater shoulder height at 3 years of age.
c. If you were told that the domain for these functions is the set of all real numbers, would you agree? Why or why not?
Answer:
There are physical limitations on time and height, so the domain must be greater than or equal to zero but must not exceed the finite limit of their life spans, and the range must both be greater than or equal to the finite heights recorded at birth, and less than or equal to their maximum possible heights. Both the domain and range may have other limitations as well. For example, neither animal will grow continuously for his lifetime; rather, both are likely to shrink if they live to an old age.
Eureka Math Algebra 1 Module 4 Lesson 22 Exercise Answer Key
Opening Exercise
Populate the table on the right with values from the graph.
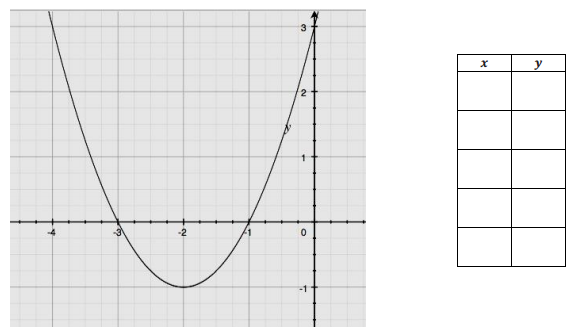
Answer:
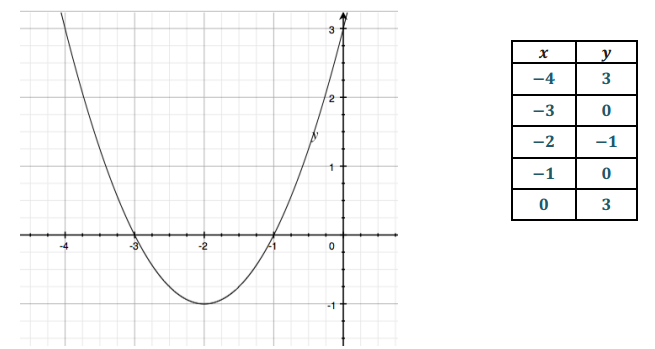
Briefly discuss ways to recognize key features in both representations of this function.
→ What is the vertex for the function? Find it and circle it in both the table and the graph.
( – 2, – 1)
→ What is the y – intercept for the function? Find it and circle it in both the table and the graph.
(0, 3)
→ What are the x – intercepts for the function? Find them and circle them in both the table and the graph.
( – 3, 0) and ( – 1, 0)
→ What components of the equation for a function give us clues for identifying the key features of a graph?
Given a quadratic function in the form f(x) = ax2 + bx + c, the y – intercept is represented by the constant, c; the vertex (h, k) can be seen in the completed – square form, f(x) = a(x – h)2 + k; and the zeros of the function are found most readily in the factored form, f(x) = a(x – m)(x – n).
→ How can the key features of the graph of a quadratic function give us clues about how to write the function the graph represents?
Given a graph of a quadratic function, (h, k) represents the vertex (i.e., maximum or minimum point). These values, h and k, can be substituted into the vertex form. Then, substituting any other ordered pair for (x, y), which represents a point on the quadratic curve (e.g., the y – intercept), will allow you to solve for the leading coefficient, a, of the vertex form of a quadratic function.
→ When both x – intercepts are visible, we can write the equation of the graph in factored form using the coordinates of any other point to determine the leading coefficient. And when the y – intercept and only one x – intercept are visible, we can most easily write the function by using standard form. In this case, the y – intercept tells us the value of the constant term, c, and we can use two other points to substitute for x and y into the form f(x) = ax2 + bx + c to determine the specific values for a and b.
Eureka Math Algebra 1 Module 4 Lesson 22 Problem Set Answer Key
Question 1.
One type of rectangle has lengths that are always two inches more than their widths. The function f describes the relationship between the width of this rectangle in x inches and its area, f(x), in square inches and is represented by the table below.
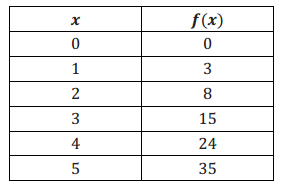
A second type of rectangle has lengths that are always one half of their widths. The function g(x) = \(\frac{1}{2}\) x2 describes the relationship between the width given in x inches and the area, g(x), given in square inches of such a rectangle.
a. Use g to determine the area of a rectangle of the second type if the width is 20 inches.
Answer:
g(x) = \(\frac{1}{2}\) x2
g(20) = \(\frac{1}{2}\) (20)2
g(20) = 200
The area of the rectangle is 200 in2.
b. Why is (0, 0) contained in the graphs of both functions? Explain the meaning of (0, 0) in terms of the situations that the functions describe.
Answer:
For the first type of rectangle (with length two inches more than its width), a width of 0 in. means that the rectangle’s length is 2 in. However, if the width is 0 in., its area is 0 in2, and there is no rectangle. For the second type of rectangle (represented by g), a width of 0 in. means that the rectangle’s area is 0 in2. Although the point (0, 0) is contained in the graphs of both functions, it does not represent any rectangle width area pair because rectangles by definition have positive widths and lengths.
c. Determine which function has a greater average rate of change on the interval 0 ≤ x ≤ 3.
Answer:
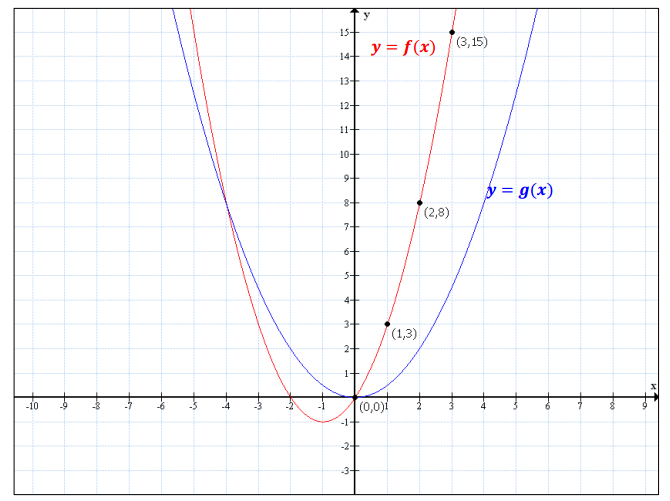
On the interval 0 ≤ x ≤ 3, f has a greater average rate of change than g, as seen in the graphs of the functions above. The average rate of change for f is (\(\frac{f(3) – f(0)}{3 – 0}\) = 5, while the average rate of change for g is \(\frac{g(3) – g(0)}{3 – 0}\) = \(\frac{3}{2}\).
d. Interpret your answer to part (c) in terms of the situation being described.
Answer:
The area of rectangles, on average, on the interval 0 ≤ x ≤ 3 is growing a little more than 3 times faster for rectangles described by the function f than those described by the function g of a certain width.
e. Which type of rectangle has a greater area when the width is 5 inches? By how much?
Answer:
According to the table, the first rectangle will have an area of 35 in2 if its width is 5 in. Using the formula for g, g(5) = 12.5, the second rectangle will have an area of 12.5 in2 if its width is 5 in. The first type of rectangle has an area that is 22.5 in2 greater than the second type of rectangle when their widths are 5 in.
f. Will the first type of rectangle always have a greater area than the second type of rectangle when widths are the same? Explain how you know.
Answer:
If we consider rectangles with width c, where c > 0, then c + 2 > \(\frac{1}{2}\) c, so (c + 2) ⋅ c > ( \(\frac{1}{2}\) c) ⋅ c. This means that the areas of the first type of rectangle will always be greater than the areas of the second type of rectangle when they have the same width.
Question 2.
The function given by the equation y = \(\sqrt{x}\) gives the edge length, y units, of a square with area x square units. Similarly, the graph below describes the length of a leg, y units, of an isosceles right triangle whose area is x square units.
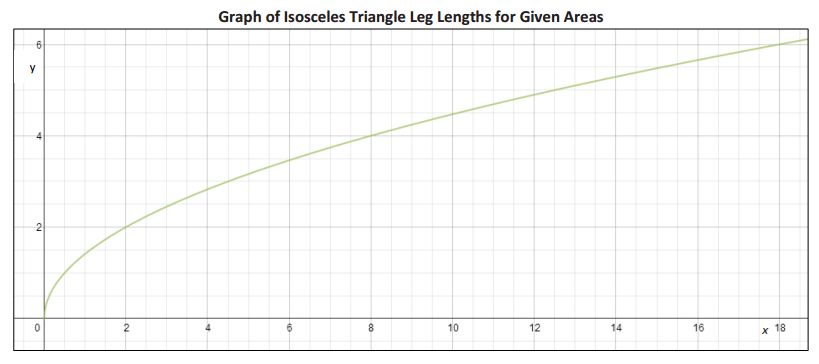
a. What is the length of a leg of an isosceles right triangle with an area of 12 square units?
Answer:
The length of a leg of an isosceles triangle with an area of 12 square units is approximately 4.9 units.
b. Graph the function that represents a square with area x square units using the same graph that was given. Which function has a greater average rate of change on the interval 0 ≤ x ≤ 3?
Answer:
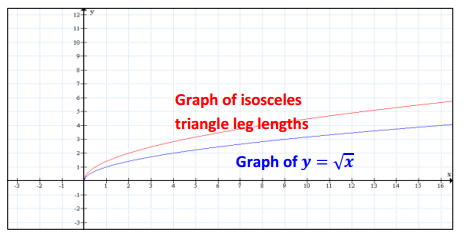
The graphs of both functions intersect at the origin. According to the provided graph, when the area of an isosceles triangle is 3 square units, the length of a leg is approximately 2.4 units. Thus, the average rate of change is approximately 0.8. Using the equation y = \(\sqrt{x}\), if x = 3, y ≈ 1.7. This means that when the area of a square is 3 square units, the length of a leg is approximately 1.7 units. Thus, the average rate of change is approximately 0.6. The average rate of change of the legs of an isosceles triangle is greater than the average rate of change of the sides of a square on the interval 0 ≤ x ≤ 3.
c. Interpret your answer to part (b) in terms of the situation being described.
Answer:
Over the interval 0 ≤ x ≤ 3, the average rate of change for the lengths of the legs of an isosceles triangle per a given area is approximately \(\frac{4}{3}\) greater than the average rate of change for the sides of the square. In other words, for every unit of change in area, the legs grow (on average) by 0.2 units more over the interval
0 ≤ x ≤ 3.
d. Which will have a greater value: the edge length of a square with area 16 square units or the length of a leg of an isosceles right triangle with an area of 16 square units? Approximately by how much?
Answer:
According to the graph, the length of the leg of an isosceles right triangle with an area of 16 square units is approximately 5.7 units. Using the equation y = \(\sqrt{x}\), the length of the sides of a square with an area of 16 square units is 4 units. The leg of the isosceles right triangle is approximately 1.7 units greater than the side lengths of the square when their areas are 16 square units.
Question 3.
A portion of a graph of a cube root function, f, and select values of a square root function, g, are given below. The domain of g is ≥ 0 .
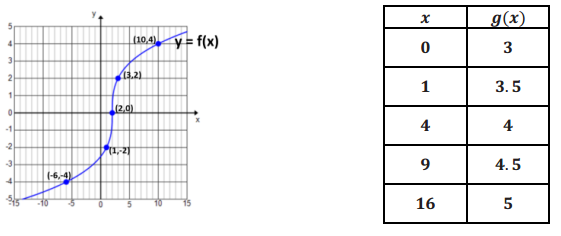
Fill in each blank with one of the following: >, <, or = .
a. f(2) _______ g(2)
Answer:
f(2) = 0 and g(2) is between 3.5 and 4.
f(2) < g(2)
b. y – intercept of f ______ y – intercept of g
Answer:
The y – intercept of f is between – 2 and – 3. The y – intercept of g is 3.
y – intercept of f < y – intercept of g
c. Average rate of change of f on interval [0, 16] ______ Average rate of change of g on interval [0, 16]
Answer:
f(x) = 2\(\sqrt [ 3 ]{ x – 2 }\)
Average rate of change of f on interval [0, 16] = \(\frac{f(16) – f(0)}{16 – 0} = \frac{2 \sqrt[3]{14} – 2 \sqrt[3]{ – 2}}{16}\) ≈ 0.459
Average rate of change of g on interval [0, 16] = \(\frac{g(16) – g(0)}{16 – 0}\) = \(\frac{5 – 3}{16}\) = 0.125
Average rate of change of f on interval [0, 16] > Average rate of change of g on interval [0, 16]
Eureka Math Algebra 1 Module 4 Lesson 22 Exit Ticket Answer Key
Question 1.
Two people, each in a different apartment building, have buzzers that don’t work. They both must throw their apartment keys out of the window to their guests, who will then use the keys to enter.
Tenant 1 throws the keys such that the height – time relationship can be modeled by the graph below. On the graph, time is measured in seconds, and height is measured in feet.
Tenant 2 throws the keys such that the relationship between the height of the keys (in feet) and the time that has passed (in seconds) can be modeled by h(t) = – 16t2 + 18t + 9.
a. Whose window is higher? Explain how you know.
Answer:
The window for Tenant 1 is higher (15 ft.) than that of Tenant 2 (9 ft.), which can be seen by comparing the values of the y – intercepts. You can see this in the graph below, showing both functions on the same coordinate plane.
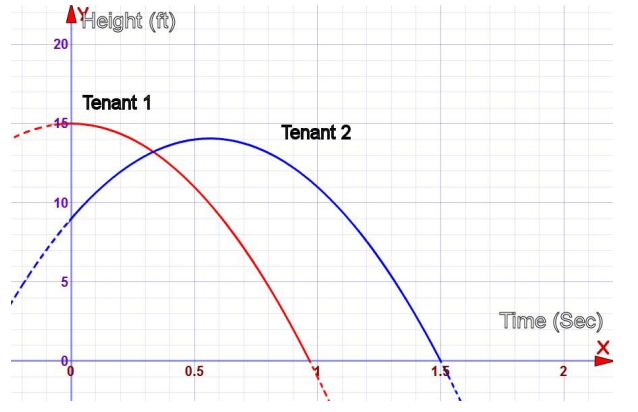
b. Compare the motion of Tenant 1’s keys to that of Tenant 2’s keys.
Answer:
Tenant 2’s keys reach a maximum height at the vertex and then fall back toward the ground. (See the graph on the previous page.) The vertex for the graph of h can be found by completing the square:
h(t) = – 16(t2 – (\(\frac{18}{16}\))t + ) + 9
= – 16(t2 – (\(\frac{9}{8}\))t + (\(\frac{9}{16}\))2 ) + 9 + 16(\(\frac{9}{16}\))2
= – 16(t – \(\frac{9}{16}\))2 + \(\frac{225}{16}\).
So, the keys will reach a height of \(\frac{225}{16}\) ft., or about 14 ft., before beginning the descent.
By comparison, Tenant 1’s keys’ motion is free falling. No linear term for Tenant 1 means an initial velocity of 0 ft/sec initial velocity; this is a quadratic graph whose axis of symmetry is the y – axis.
c. In this context, what would be a sensible domain for these functions?
Answer:
Both domains would be positive. For Tenant 2, the zeros are ( – 0.375, 0) and (1.5, 0), so the domain is [0, 1.5]. For Tenant 1, the domain is [0, 1] since the keys would be on the ground at about 1 second.