Engage NY Eureka Math Algebra 1 Module 3 Lesson 22 Answer Key
Eureka Math Algebra 1 Module 3 Lesson 22 Exercise Answer Key
Mathematical Modeling Exercise
The lionfish is a fish that is native to the western Pacific Ocean. The lionfish began appearing in the western Atlantic Ocean in 1985. This is probably because people bought them as pets and then dumped them in waterways leading to the ocean. Because it has no natural predators in this area, the number of lionfish grew very quickly and now has large populations throughout the Caribbean as well as along the eastern coastline of the United States and the Gulf of Mexico. Lionfish have recently been spotted as far north as New York and Rhode Island.
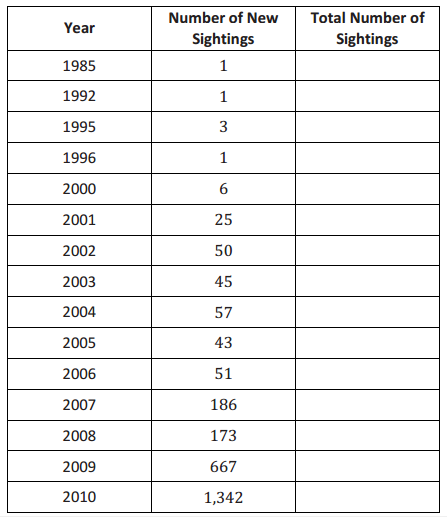
The table below shows the number of new sightings by year reported to NAS (Nonindigenous Aquatic Species), which is a branch of the U.S. Geological Survey Department.
Exercise 1.
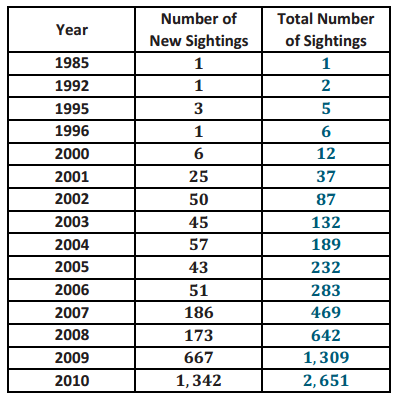
Complete the table by recording the total number of sightings for each year.
Answer:
Exercise 2.
Examine the total number of sightings data. Which model appears to be a better fit for the data—linear or exponential? Explain your reasoning.
Answer:
Exponential. For example, the total number of sightings appears to have doubled each of the last three years.
Exercise 3.
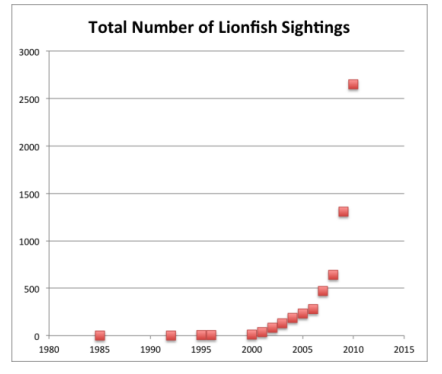
Make a scatter plot of the year versus the total number of sightings.

Answer:
Exercise 4.
Based on the scatter plot, either revise your answer from Exercise 2 or explain how the scatter plot supports your answer from Exercise 2.
Answer:
Answers will vary. If students responded in Exercise 2 that an exponential model would be a better fit, then the scatter plot supports their initial response since the data points appear to form an exponential curve. If students responded that a linear model would be a better fit, then they should revise their initial response to say that an exponential model would be better for this data since the scatter plot looks like an exponential curve.
Exercise 5.
On the scatter plot, draw a smooth curve that best fits the data.
Answer:
The smooth curve should look similar to the above scatter plot.
Exercise 6.
From your table, calculate the average rate of change in the total number of sightings for each of the following time intervals.
a. 1995–2000
Answer:
1.4
b. 2000–2005
Answer:
44
c. 2005–2010
Answer:
484
Exercise 7.
How do the average rates of change help to support your argument of whether a linear or an exponential model is better suited for the data?
Answer:
If the model total number of sightings was growing linearly, then the average rate of change would be constant. Instead, it appears to be growing multiplicatively, indicating an exponential model.
Exercise 8.
Use the regression feature of a graphing calculator to find an equation that models the number of lionfish sightings each year.
Answer:
Answers will vary depending on the technology used. If the selected technology is not sensitive enough to display the equation for the exponential model, provide students with the equation below.
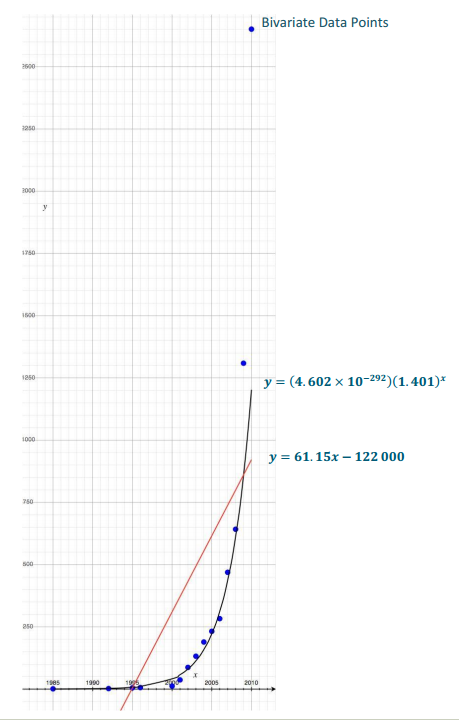
Let x represent the year.
Exponential model: y = (4.602×10(-292)) (1.401)x
Linear model: y = 61.15x-122 000
Exercise 9.
Use your model to predict the total number of lionfish sightings by the end of 2013.
Answer:
Exponential: 2,773 total sightings
Linear: 1,095 total sightings
Exercise 10.
The actual number of sightings as of July 2013 was 3,776. Does it seem that your model produced an accurate prediction? Explain.
Answer:
Answers will vary. See the Closing below.
Eureka Math Algebra 1 Module 3 Lesson 22 Problem Set Answer Key
Question 1.
Another Invasive Species Problem: Kudzu
Kudzu, a perennial vine native to Southeast Asia, now covers a large area of the southern United States. Kudzu was promoted as a forage crop and an ornamental plant when it was introduced to the U.S. at the Philadelphia Centennial Exposition in 1876. Many southern farmers were encouraged to plant kudzu for erosion control from the mid-1930s to the mid-1950s. In 1953, kudzu was removed from the U.S. Department of Agriculture’s list of permissible cover plants due to its recognition as an invasive species.
Look up information about kudzu in the U.S. on Wikipedia, and write a short (1- to 2-page) report on the growth of kudzu since its introduction. In your report, choose a function (linear or exponential) to model and graph the growth of kudzu (in hectares) in the U.S. per year over the past half century or so. Remember to cite your sources!
Answer:
To the teacher: Point out that the report is not about getting a correct answer but how they explain and manipulate the data that they find. Hence, it is important for them to cite their sources. (Note: A rough estimate of how kudzu spreads, 50,000 hectares per year, is on the Wikipedia page—challenge them to find out more than that.)
Eureka Math Algebra 1 Module 3 Lesson 22 Exit Ticket Answer Key
Question 1.
For the equation found in Exercise 8, explain the parameters of the equation within the context of the problem.
Answer:
a = 4.602 × 10(-292), at x = 0; there were virtually no lionfish in the Atlantic Ocean.
b = 1.401; the population of lionfish grew by this constant quotient of change every year.
Question 2.
Given each of the following, describe what features in the data or graph make it apparent that an exponential model would be more suitable than a linear model.
a. The table of data
Answer:
The values of the lionfish sightings grow by a quotient of change rather than a constant rate of change.
b. The scatter plot
Answer:
The shape of the scatter plot looks more like an exponential curve than a line.
c. The average rates of change found in Exercise 6
Answer:
The three sets of average rates of change would have been the same, or close to the same, had the situation been more suited to a linear model.
Question 3.
Use your equation from Exercise 8 to predict the number of lionfish sightings by year 2020. Is this prediction accurate? Explain.
Answer:
29,375 This answer assumes that the conditions that allowed for a constant quotient of change remain the same until 2020. This is probably not a realistic scenario; change in ocean temperature, food availability, and other needs for continued exponential growth would have to remain the same to yield this projected population.