Students looking for the Bridges in Mathematics Grade 5 Student Book Answer Key Unit 8 Module 1 can find a better approach to solve the problems.
Bridges in Mathematics Grade 5 Student Book Answer Key Unit 8 Module 1
Bridges in Mathematics Grade 5 Student Book Unit 8 Module 1 Session 1 Answer Key
Temperature Conversions
The formulas for converting between Fahrenheit and Celsius are as follows:
F = (C × \(\frac{9}{5}\)) + 32
C = (F – 32) ×\(\frac{5}{9}\)
Question 1.
Use the formulas to answer the following questions.
a. A cold wintery day is about 35°F. What is that temperature in degrees Celsius?
Answer:
Given that a cold wintery day is about 35°F.
The temperature in degrees Celsius will be as below,
= (F – 32) ×\(\frac{5}{9}\)
= (35 – 32) ×\(\frac{5}{9}\)
= 3 ×\(\frac{5}{9}\)
= \(\frac{5}{3}\)°C
= 1.6°C
b. The temperature of a dog is about 101°F. What is the dog’s temperature in degrees Celsius?
Answer:
Given that the temperature of a dog is about 101°F.
The temperature in degrees Celsius will be as below,
= (F – 32) ×\(\frac{5}{9}\)
= (101 – 32) ×\(\frac{5}{9}\)
= 69 ×\(\frac{5}{9}\)
= \(\frac{115}{3}\)
= 38.3°C
Question 2.
The temperature in the Sahara Desert can reach 78°C. What is that temperature in degrees Fahrenheit?
Answer:
Given that the temperature in the Sahara Desert can reach 78°C.
The temperature in degrees Fahrenheit will be as below,
F = (C × \(\frac{9}{5}\)) + 32
= (78 × \(\frac{9}{5}\)) + 32
= (\(\frac{702}{5}\)) + 32
= 140.4 + 32
= 172.4°F
Question 3.
Write two of your own temperature conversion questions and share them with another student. Make sure you find the answers before you share.
Answer:
Equation 1 will be, converting 41°F in celsius.
= (F – 32) ×\(\frac{5}{9}\)
= (41 – 32) ×\(\frac{5}{9}\)
= 9 ×\(\frac{5}{9}\)
= 5°C
Equation 2 will be, converting 25°C in Fahrenheit.
F = (C × \(\frac{9}{5}\)) + 32
= (25 × \(\frac{9}{5}\)) + 32
= 45 + 32
= 77°F
Bridges in Mathematics Grade 5 Student Book Unit 8 Module 1 Session 2 Answer Key
Absorbing & Reflecting Solar Energy
When solar energy strikes objects, some of the energy is absorbed and converted into heat and some is reflected. Some objects absorb more radiant energy than others.
Question 1.
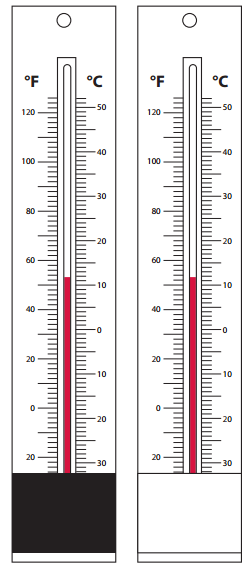
Predict what will happen when you place one thermometer on black paper and another thermometer on white paper and leave them in the sun for 5 minutes.
Prepare to test your prediction.
- Cut a 1” × 3″ strip from black paper.
- Cut a 1” × 3” strip from white paper.
- Wrap the black strip of paper around the bottom of a thermometer and tape it together on the back.
- Repeat with the white strip of paper on another thermometer.
- Save the remaining pieces of paper. They will also be used in the experiment.
Now you’ll test your prediction.
- Go outside and place the white-wrapped thermometer in the center of the white paper and the black-wrapped thermometer in the center of the black paper.
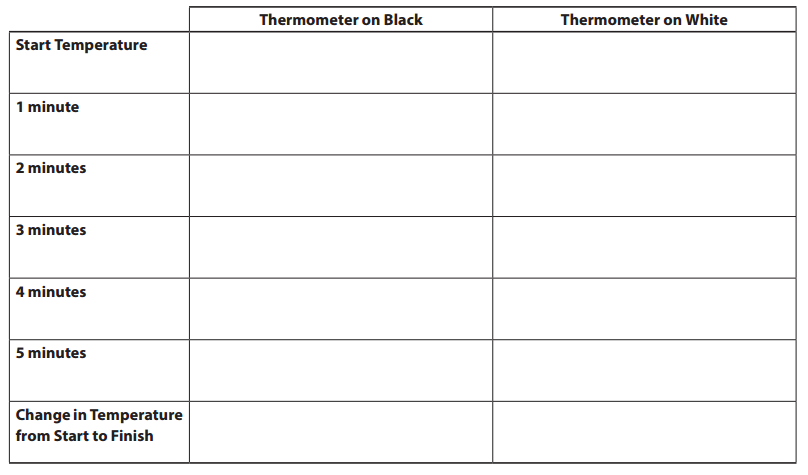
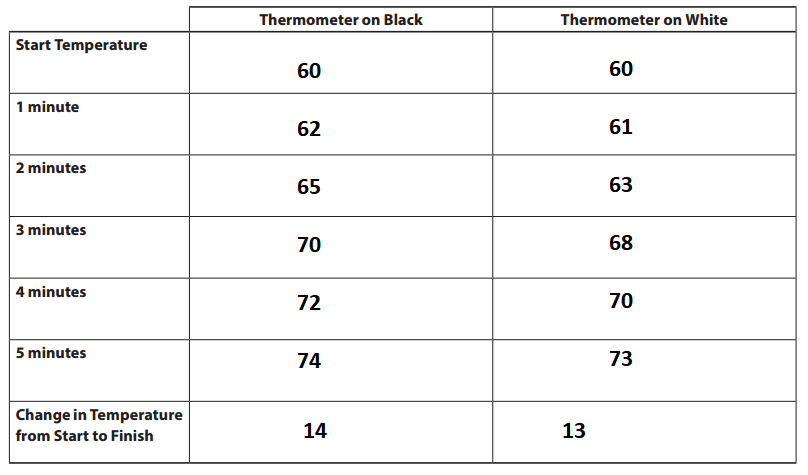
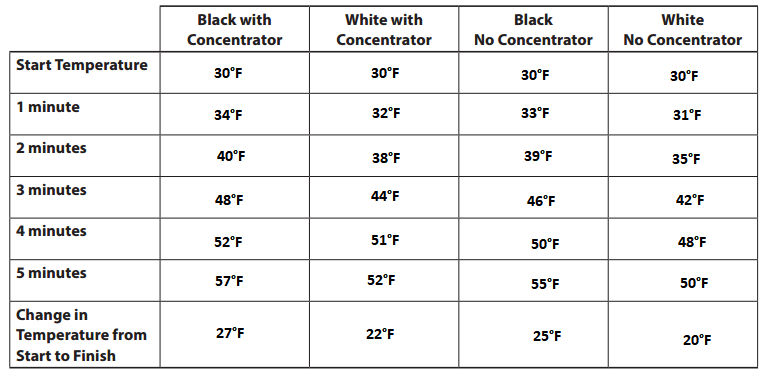
- On the table below, record the starting temperature. Then, read the temperature on each thermometer every minute for five minutes and record your readings on the table.
- Give your data table a title.
Answer:
Question 2.
What do you notice about the data? Write at least three observations. Use your math journal if you need more room.
Answer:
The data of the black thermometer is high than the white thermometer. The thermometer on the black paper is likely to read a higher temperature than the thermometer on the white paper.This is because black paper absorbs more light and heat from the sun than white paper, which reflects more light and heat.
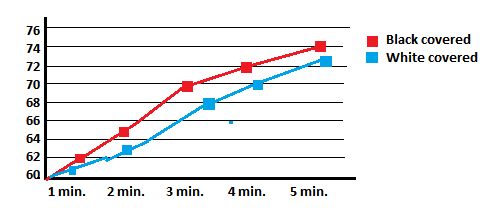
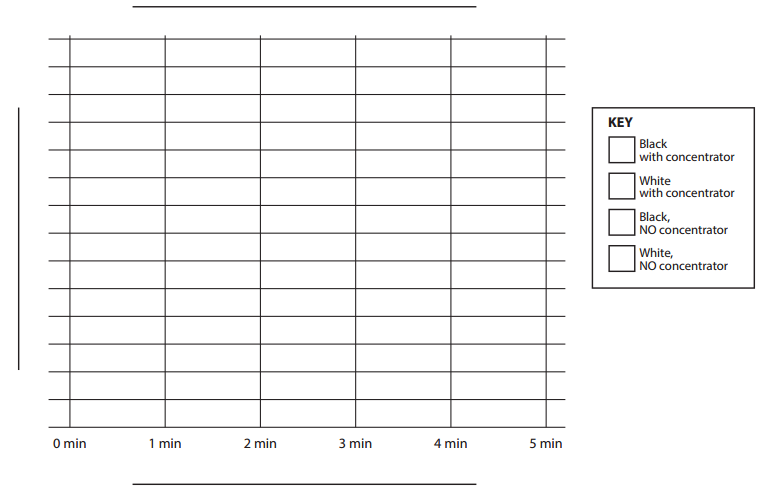
Plot the data you collected on the line graph (see your teacher if you do not yet have a sheet for the line graph).
- Give the graph a title and label each axis.
- Then use your graph to help answer the questions below.
Question 3.
Explain how to find the change in temperature by reading the graph.
Answer:
To find the change in temperature by reading a graph, we need the initial temperature and the final temperature. The change in temperature can then be calculated by subtracting the initial temperature from the final temperature.
Question 4.
During which 1-minute period did the temperature rise the most for each thermometer? How can you tell by looking at your graph?
Answer:
Between 2min-3min, the black covered thermometer has rose the most. By observing the graph slope, we can observe the temperature changes.
Question 5.
Describe at least two things you learned about the reflection and absorption of solar energy by conducting today’s experiment.
Answer:
The color of an object affects its ability to absorb or reflect solar energy. The darker colors absorb more solar energy, while lighter colors reflect more solar energy.
The material of an object can also affect its ability to absorb or reflect solar energy.
Question 6.
CHALLENGE Predict the temperature of the thermometer on the black paper after 15 minutes and explain your reasoning.
Answer:
After 15 minutes, the temperature of the thermometer on the black paper will continue to increase at a slower rate than during the first few minutes.
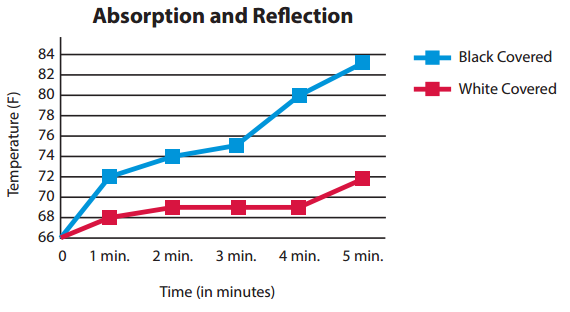
Reading a Line Graph
One pair of students in Mr. Ivy’s class collected the data in the graph below.
Question 1.
What was the change in temperature for the black-covered thermometer after 5 minutes?
Answer:
The temperature for the black-covered thermometer after 5 minutes will be 83°F.
Question 2.
What was the difference between the black and the white-covered thermometers’ ending temperatures?
Answer:
The ending temperature of black-covered thermometer is 83°F
The ending temperature of black-covered thermometer is 72°F
The difference between the black and the white-covered thermometers’ ending temperatures will be 83°F-72°F=11°F
Question 3.
During which 1-minute period did the temperature rise the most for the black- covered thermometer?
Answer:
During 3-4 minute period the temperature rose the most for the black- covered thermometer.
Question 4.
Mr. Ivy’s class covered a thermometer in foil. They collected the change in temperature at the same time they collected data for the white and black-covered thermometers.
a. Predict what the change in temperature for the foil-covered thermometer would look like. Show your prediction on the graph at the top of the page.
Answer:
Here the blue line indicates the white-covered thermometers and the balck line indicates black-covered thermometers.
The change in temperature is as shown in the graph below.
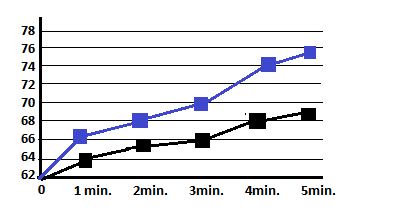
b. Explain the reasoning for your prediction.
Answer:
The temperature of the thermometer with the foil is less despite the fact that the aluminium is a metal and a good conductor of heat. Therefore, the temperature will go down.
Bridges in Mathematics Grade 5 Student Book Unit 8 Module 1 Session 3 Answer Key
Concentrating Solar Energy
Today teams will set up thermometers just like in the last session, except you will concentrate solar energy on two of the thermometers, one wrapped in black and one wrapped in white. The other thermometers will not have concentrators.
Question 1.
Predict what will happen to each of the four thermometers when they are placed in the sun.
Answer:
The thermometers with concentrators will have more temperature than the thermometers without concentrators.
Thermometer wrapped in black will absorb more energy than the thermometer wrapped in white.
Question 2.
Follow these directions with your partner to make a solar concentrator.
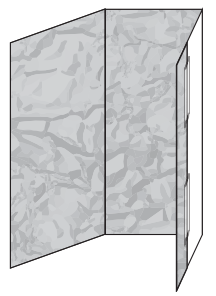
- Get 1 piece of card stock and 1 piece of aluminum foil from your teacher.
- Fold the card stock into thirds, and then open it again.
- Wrap the edges of the foil around the card stock and tape it to the back.
- You now have a solar concentrator!
Answer:
By performing the above steps, we can build a solar concentrator.
Question 3.
Go outside and work with another pair to conduct the experiment.
- Place your two white-wrapped thermometers in the center of the white pieces of paper and your two black-wrapped thermometers in the center of the black pieces of paper.
- Position a concentrator behind one of the black thermometers and the other concentrator behind one of the white thermometers, so each reflects and concentrates the sun directly onto each thermometer.
Answer:
When the two white-wrapped thermometers is placed in the center of the white pieces of paper and the two black-wrapped thermometers is placed in the center of the black pieces of paper, the black ones will have increase in temperature than the white ones.
Question 4.
Measure and record the starting temperature of each thermometer. Continue to measure and record the temperature every minute for 5 minutes.
Answer:
Question 5.
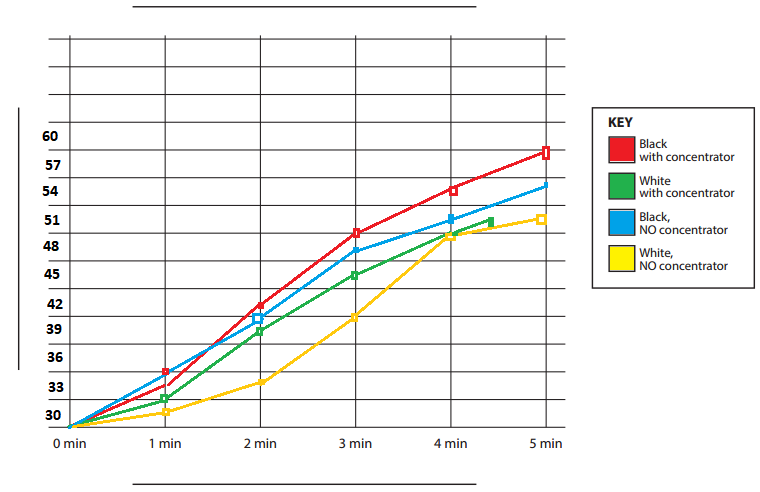
Plot the data you collected on the graph below. Give the graph a title and label each axis.
Answer:
Question 6.
What do you notice about the data? Write at least two observations.
Answer:
Thermometer with concentrators got heated first.
The black color thermometers will have more temperature than the white ones.
Question 7.
What is the difference in temperature after 5 minutes between the thermometer that absorbed the most solar energy and the one that absorbed the least?
Answer:
The most recorder temperature after 5 minutes is 57°F
The least recorded temperature after 5 minutes is 50°F
The difference in temperature after 5 minutes between the thermometer that absorbed the most solar energy and the one that absorbed the least will be 57°F – 50°F = 7°F
Question 8.
Look at your graph. During which 1-minute period did the temperature rise the most for each thermometer?
Answer:
By looking at the graph, the temperature rose between 2-3 minutes.
Question 9.
Describe at least two things you learned about concentrating solar energy by conducting today’s experiment.
Answer:
The thermometers with concentrators heats up faster than the ones without concentrators.
The black thermometers has more temperature than the white thermometers.
Question 10.
CHALLENGE Pose some of your own questions for your classmates to answer.
Answer:
Which thermometer heats up first?
What is the difference of thermometers with concentartors and without concentrators?
Solar Concentration
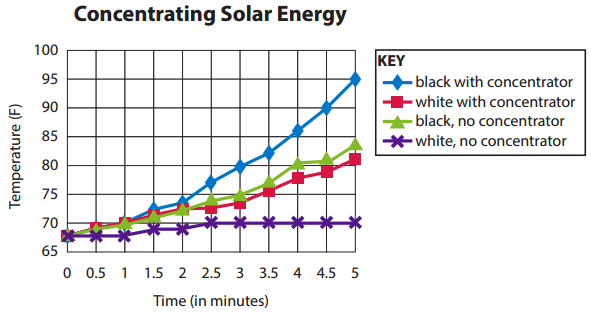
A team of students in Mr. Ivy’s class concentrated solar energy on thermometers and collected data. The graph below shows the data the students collected.
Question 1.
What was the change in temperature from start to finish for the white thermometer with the concentrator?
Answer:
The start for the white thermometer with the concentrator is 67°F.
The finish for the white thermometer with the concentrator is 70°F.
The change in temperature from start to finish will be 70-67=3°F.
Question 2.
What is the difference in temperature after 5 minutes between the thermometer that absorbed the most solar energy and the one that absorbed the least?
Answer:
The temperature of the thermometer that absorbed the most solar energy is 95°F.
The temperature of the thermometer that absorbed the least solar energy is 70°F.
The difference in temperature after 5 minutes between the thermometer that absorbed the most solar energy and the one that absorbed the least will be 95°F – 70°F = 25°F.
Question 3.
How long did the white thermometer without the concentrator remain at a constant temperature?
Answer:
The thermometer without the concentrator remained contant from 2.5 min to 5 min which is 2.5 min.
Question 4.
During which half-minute period did the temperature rise the most for each thermometer?
Answer:
Between 1.5 to 2 mins the temperature rose the most for each thermometer.
Question 5.
Did the concentrator make a difference in the amount of solar energy that was absorbed by the thermometers? Explain your reasoning.
Answer:
Yes, the thermometer with concentrators got heated first.
The black color thermometers with and without concentrators will have more temperature than the white ones as black absorbs more heat than the white ones.
Bridges in Mathematics Grade 5 Student Book Unit 8 Module 1 Session 4 Answer Key
Collecting Solar Energy
Solar collectors absorb solar energy, convert it into heat and then hold the heat, rather than letting it escape rapidly back into the atmosphere. During today’s experiment, you will explore some conditions that best hold the heat.
Question 1.
Follow these directions to set up the experiment.
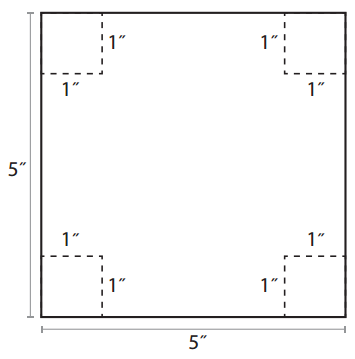
- Cut out four trays, two from white paper and two from black paper, that each have a base of 3″ by 3″ and height of 1″. Use clear tape to tape the edges.
- Get four plastic cups.
- Add \(\frac{1}{3}\) cup of water to each cup.
- Place a thermometer in each cup.
- Cover two cups with plastic wrap held in place with rubber bands.
- Place one covered cup in a white tray and one uncovered cup in a white tray. Place one covered cup in a black tray and one uncovered cup in a black tray.
- When your teachers directs you to, record the temperature of the water in each cup. Then go outside and place the cups and trays in a sunny place so that the sun is directly over them and there are no shadows covering them.
- Leave the cups in the sun for 30 minutes and then find and record the temperature of each cup of water.
Answer:
Follow the above instructions to setup the experiment.
Question 2.
Predict what will happen. Explain your reasoning.
Answer:
The balck cover will get heated up faster than the white covers. As black absorbs more heat than the white colour.
Question 3.
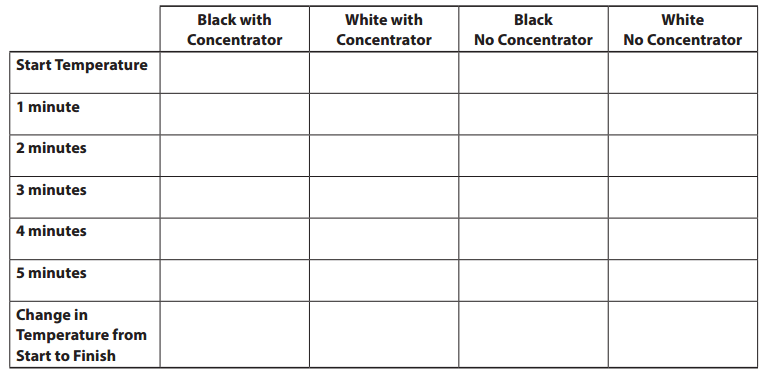
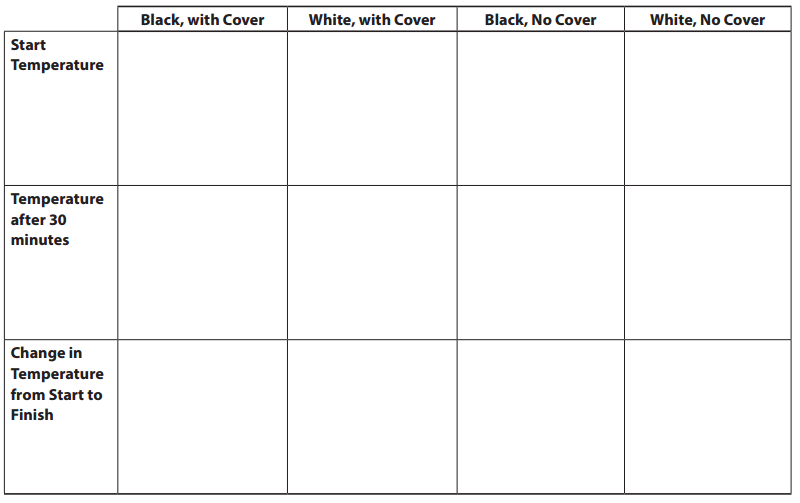
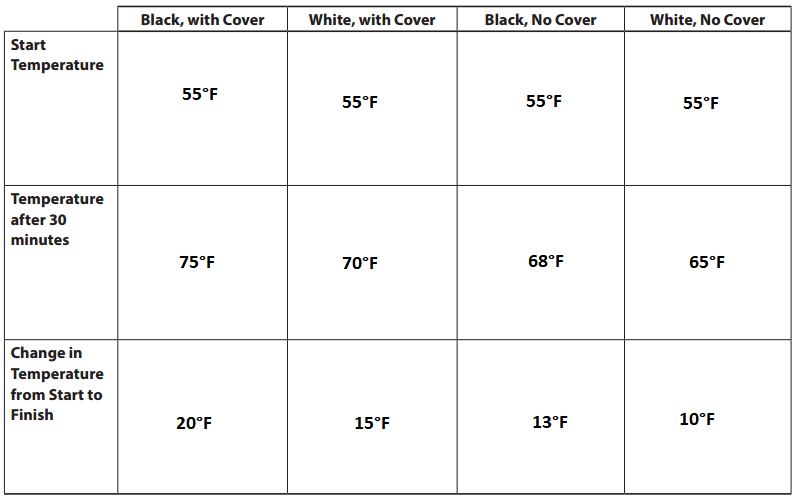
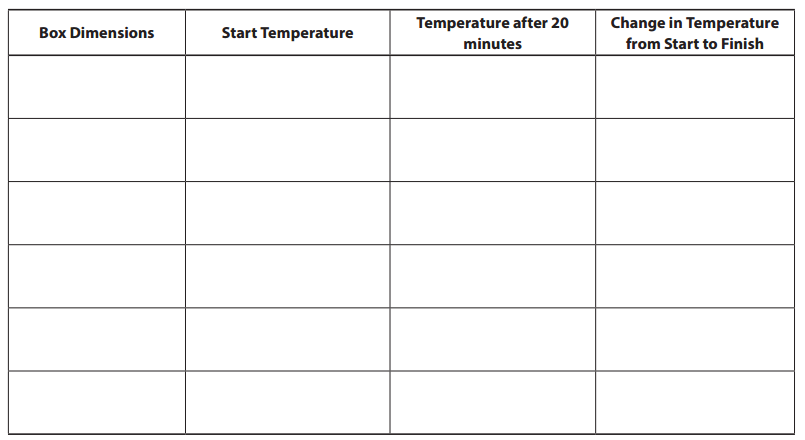
In the following table, record the starting temperature of the water in each cup before you go outside. Then record the water temperature after the cups have been in the sun for 30 minutes. Calculate the change in temperature for each cup of water. When you are finished, give your table a title.
Answer:
Question 4.
Look at your graph. What do you notice about the data?
Answer:
The data for black colour is more than that of the white colour.
Question 5.
What is the difference in temperature between the collector that absorbed the most solar energy and the one that absorbed the least?
Answer:
The temperature of the collector that absorbed the most solar energy is 75°F and the one that absorbed the least is 65°F.
The difference in temperature between the collector that absorbed the most solar energy and the one that absorbed the least will be 75°F – 65°F = 10°F
Question 6.
Describe at least two things you learned about collecting and storing solar energy by conducting today’s experiment.
Answer:
The cups with covers heats up faster than the ones without covers.
The black cups will have more temperature than the white cups.
Question 7.
CHALLENGE What could you change in these solar collectors to make them absorb more solar energy? Explain your reasoning.
Answer:
All the cups can be covered with black ones, by doing this the cups will absorb more solar than the white ones as black colour absorbs more energy than the white ones.
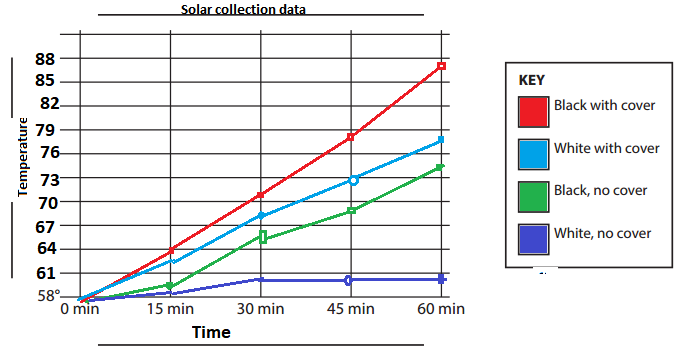
Solar Collection
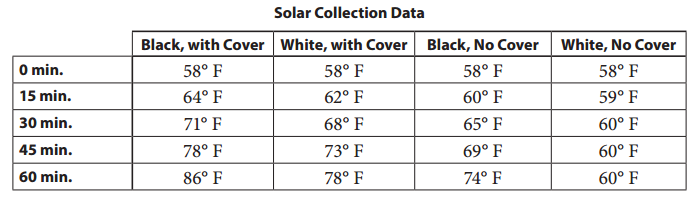
A pair of students in Mr. Ivy’s class collected the data in the table below.
Question 1.
Create a graph to show their data. Be careful to set up a scale along the vertical axis that goes from the lowest to the highest temperature they recorded. Remember to title and label the graph.
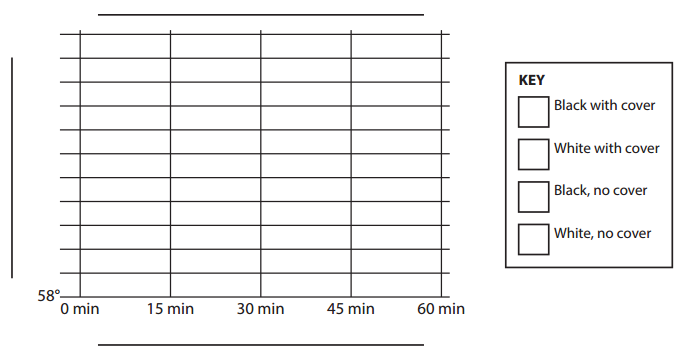
Answer:
Do the work and show your answers to questions 2-5 in your math journal.
Question 2.
What do you notice about the data these students collected? Write at least two observations.
Answer:
The cups with covers heats up faster than the ones without covers.
The black cups will have more temperature than the white cups.
Question 3.
What is the difference in temperature between the collector that absorbed the most solar energy after 60 minutes and the one that absorbed the least?
Answer:
The collector that absorbed the most solar energy after 60 minutes is 64 and the one that absorbed the least is 60.
The difference in temperature between the collector that absorbed the most solar energy after 60 minutes and the one that absorbed the least will be 64°F – 60°F = 4°F.
Question 4.
During which 15-minute period did the temperature rise the most for each cup of water?
Answer:
During 30 to 45 minute period the temperature rose the most for each cup of water.
Question 5.
CHALLENGE Convert the starting temperature and the temperature of each cup after 60 minutes to degrees Celsius. Use the formula C = (F – 32) × \(\frac{5}{9}\).
Answer:
The starting temperature is 55°F.
C = (F – 32) × \(\frac{5}{9}\)
= (55 – 32) × \(\frac{5}{9}\)
= 23 × \(\frac{5}{9}\)
= 115/9
= 12.7°C
Bridges in Mathematics Grade 5 Student Book Unit 8 Module 1 Session 5 Answer Key
Solar Boxes
Question 1.
Write your prediction for which of the boxes with a volume of 24 cubic inches will collect the most solar energy in 20 minutes. Explain your reasoning.
Answer:
The boxes with a volume of 24 cubic inches will collect the most solar energy in 20 minutes.
Question 2.
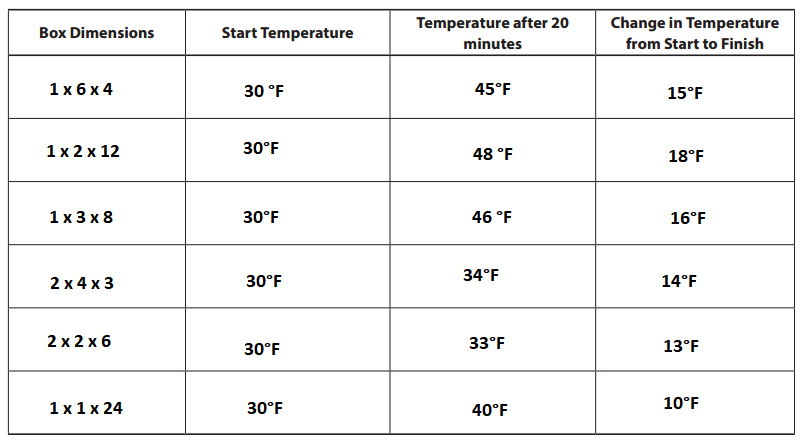
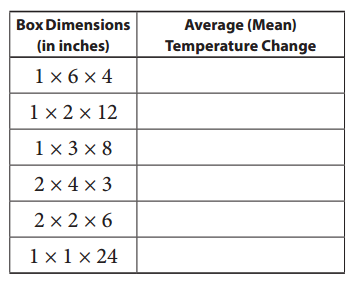
In the following table, record the starting temperature of each box and then its temperature after 20 minutes of being in the sun. Calculate the change in temperature for each box. Remember to give your table a title.
Answer:
Question 3.
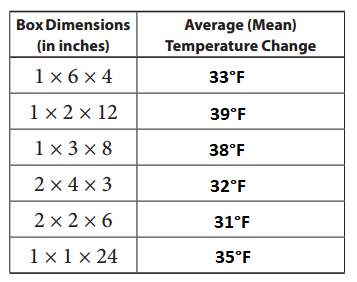
Find the average (mean) temperature change for each box placed in the sun. Use the data from the chart your class created. Show your work.
Answer:
Question 4.
Which box had the greatest average change in temperature? Why do you think it worked out that way?
Answer:
1x2x12 dimesion box had the greatest average change in temperature.
Due to the large surface area, the tempearture is high.
Question 5.
CHALLENGE If we had a collector with a volume of 48 cubic inches, which box dimensions should we expose to the sun? Explain your reasoning.
Answer:
The box with a volume of 48 cubic inches with absorb more energy than the box with a volume of 24 cubic inches.
Since the surface area is more, the box will absorb more energy than the other one.
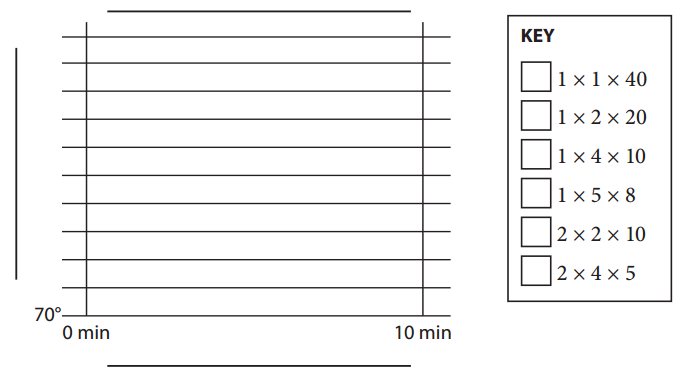
More Solar Boxes
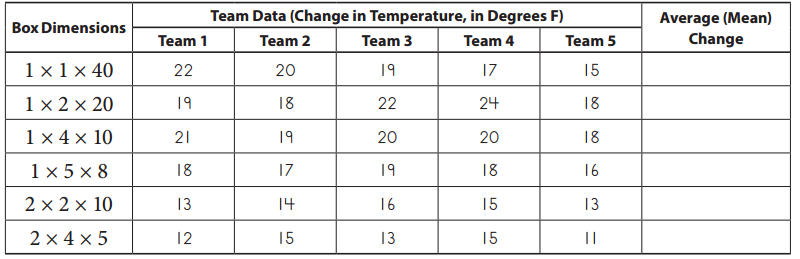
Mr. Ivy’s class made solar collector boxes with a volume of 40 cubic inches, then gathered solar collection data for 10 minutes. Their data is in the table below.
Question 1.
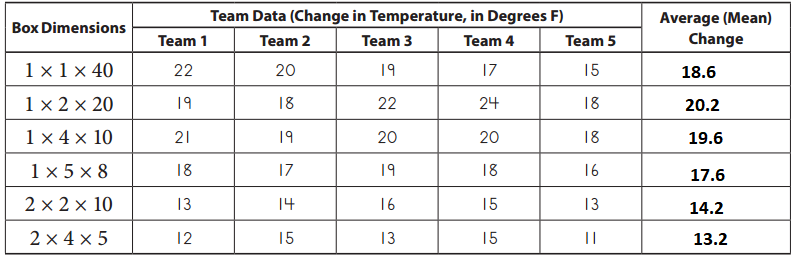
Calculate the mean temperature change for each collector, and record it in last column. Reminder: To find the mean temperature change for each box, add the 5 data entries in the row, and divide the total by 5. Do the work in your math journal.
Answer:
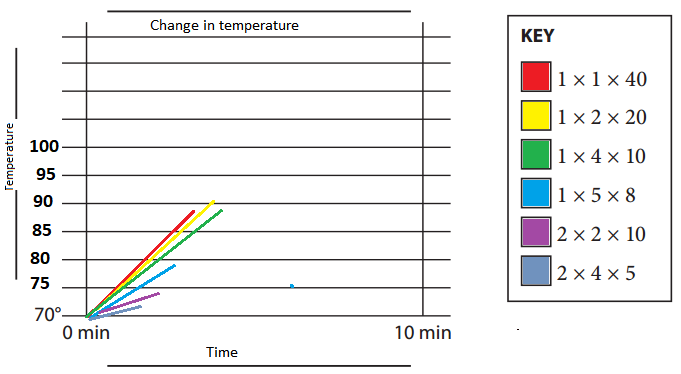
Question 2.
The temperature of the collectors at the start of the experiment was 70° F. Create a graph to show the mean temperature change for each box. Give the graph a title and label the axes. Use different colored pencils to represent each collector.
Answer:
Question 3.
What is the difference in mean average temperature change between the collector that absorbed the most solar energy and the one that absorbed the least?
Answer:
The mean average temperature that absorbed the most solar energy is 20°F.
The mean average temperature that absorbed the least solar energy is 13°F.
The difference in mean average temperature change between the collector that absorbed the most solar energy and the one that absorbed the least will be 20°F -13°F = 7°F
Bridges in Mathematics Grade 5 Student Book Unit 8 Module 1 Session 6 Answer Key
Changing Surface Area
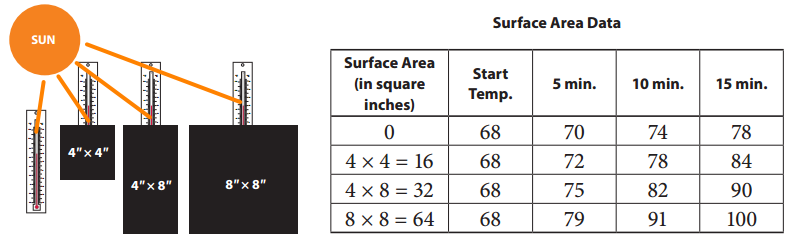
Question 1.
Mr. Ivy’s class conducted an experiment to see whether changing the surface area of black paper exposed to the sun would make a difference in the amount of solar energy the paper absorbed. They set up the experiment like this:
They placed the pieces of black paper and thermometers in the sun and read their temperatures after 5, 10, and 15 minutes. The data they collected is in the table below.
a. Make a graph of their data. Give the graph a title and label the axes.
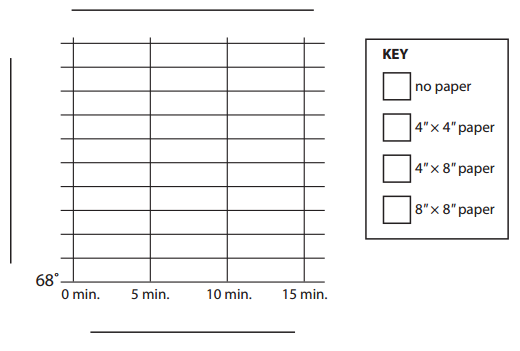
Answer:
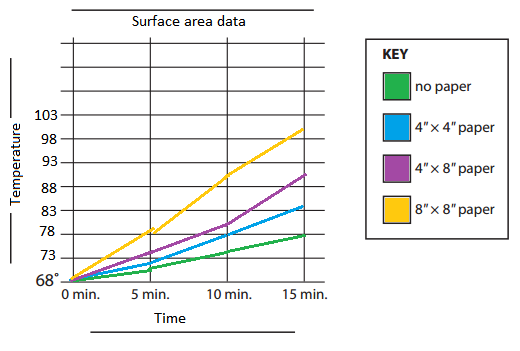
b. Maya says that when they made the surface area four times bigger, the paper absorbed twice as much solar energy. Look at the data. Is she correct? Explain your reasoning in your math journal.
Answer:
Yes, Maya is correct.
When the surface area is made four times bigger, the paper absorbs the twice as much solar energy.
Question 2.
What do you predict the temperature of a thermometer placed under a 6″ × 8″ piece of black paper exposed to the sun would read after 15 minutes? Explain your reasoning.
Answer:
The temperature of a thermometer placed under a 6″ × 8″ piece of black paper when exposed to the sun would read 95°F after 15 minutes.