We included HMH Into Math Grade 3 Answer Key PDF Module 18 Lesson 3 Use Bar Graphs to make students experts in learning maths.
HMH Into Math Grade 3 Module 18 Lesson 3 Answer Key Use Bar Graphs
I Can use data in a scaled bar graph to solve how many more and how many less problems.
Spark Your Learning
Mr. Mason’s students are showing data that they collected. On what topic might the students have collected information?
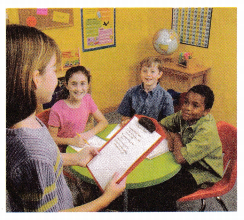
Use your idea to complete the graph.
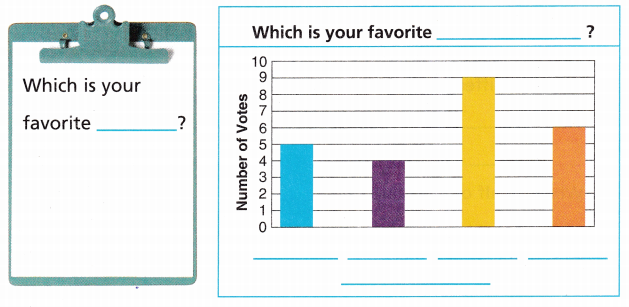
Answer:
Bar graphs are the pictorial representation of data (generally grouped), in the form of vertical or horizontal rectangular bars, where the length of bars are proportional to the measure of data. They are also known as bar charts. Bar graphs are one of the means of data handling in statistics.
In order to visually represent the data using the bar graph, we need to follow the steps given below.
– Step 1: First, decide the title of the bar graph.
– Step 2: Draw the horizontal axis and vertical axis. (For example, number of votes)
– Step 3: Now, label the horizontal axis.
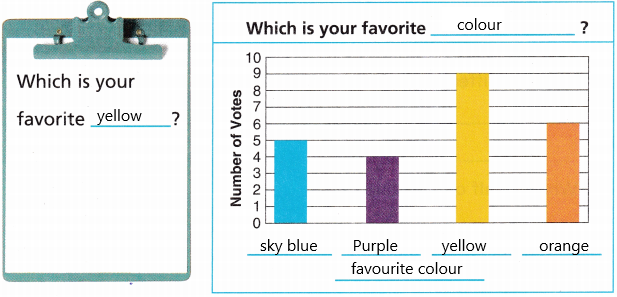
– Step 4: Write the names on the horizontal axis, such as sky blue, purple, yellow, orange
– Step 5: Now, label the vertical axis. (For example, numbers)
– Step 6: Finalise the scale range for the given data.
– Step 7: Finally, draw the bar graph that should represent each category of the pet with their respective numbers.
According to that we fill the given bar graph.
Turn and Talk Discuss your scenario with a partner. Ask your partner questions that can be answered by using the graph.
Answer:
Some favourite colours are given sky blue, purple, yellow, orange
The survey has been conducted and data was collected.
The number of votes for sky blue colour=5
The number of votes for purple colour=4
The number of votes for yellow colour=9
The number of votes for orange colour=6
The favourite colour is blue for everyone why? because as a survey conducted the number of more votes is for yellow colour.
Build Understanding
Question 1.
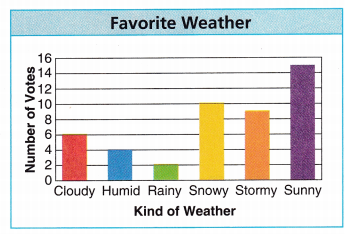
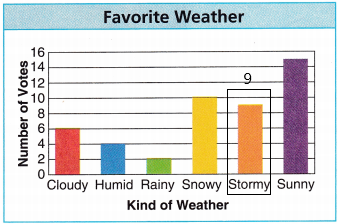
Vin asks students which kind of weather is their favorite and makes a bar graph.
Connect to Vocabulary
You previously learned to show data using picture graphs. A bar graph uses bars to show data. A scale of equally spaced numbers helps to label a graph.
Connect to Vocabulary
A vertical bar graph uses bars that go in the direction from bottom to top.
A. How do you know the scale of the bar graph? Explain.
Answer:
The number of values on the X-axis of a bar graph or the y-axis of a column graph is called the scale.
The scale is a way to show how many items are in a set.
Already given the kind of weather and number of votes.
There are 6 items they are: cloudy, humid, rainy, snowy, stormy, sunny.
The number of votes a cloudy has=6
The number of votes a humid has=4
The number of votes a rainy has=2
The number of votes a snowy has=10
the number of votes a stormy has=9
The number of votes a sunny has=15
B. How are the bars for stormy and sunny weather different than the other bars?
What is half of the scale of 2?
Answer:
the number of votes a stormy has=9
The number of votes a sunny has=15
Compared to all other weathers sunny is having the highest voting
The difference is 15-9
The difference is 6
Half of the scale of 2 is 1
C. How can you find the number of votes for stormy weather?
Answer:
The number of votes for stormy weather=9
The scale on the y-axis in increased by 2 for every next number.
0+2=2
2+2=4 and so on…
According to the bar graph, the storm was between 8 and 10
The number between 8 and 10 is 9
So, the storm votes are 9.
Turn and Talk What equation can you write to find how many more votes are for stormy weather than cloudy weather? Explain.
Answer:
The number of votes a cloudy has=6
the number of votes a stormy has=9
The equation be X
x=number of votes of storm-number of votes of cloudy
X=9-6
X=3
Therefore, 3 more votes are for stormy than cloudy.
Step It Out
Question 2.
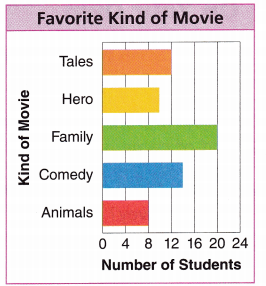
Kel surveys students about which kind of movie is their favorite and makes a bar graph.
A. What do you notice about the scale?
Answer: It is the horizontal bar graph.
When the grouped data are represented horizontally in a chart with the help of bars, then such graphs are called horizontal bar graphs, where the bars show the measure of data. The data is depicted here along the x-axis of the graph, and the length of the bars denote the values.
B. Write an equation to find the number of students who choose family movies.
Answer:
The number of students who choose family=X
According to the bar graph given above, the students who choose family movies are 20
This can be written as:
X=20
It is an equation, X is a variable that represents the unknown value.
C. If each space stands for 4 students, what does halfway between the space stand for in the graph? Explain.
Answer:
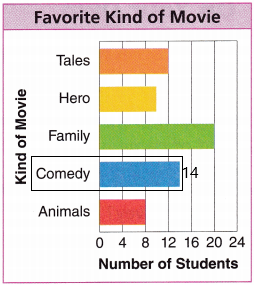
Once look at the comedy movies.
It is between 12 and 16.
each space stands for 4 students.
the numbers between 12 and 16 are 13, 14, 15
The mark is above the number 12 and it is halfway.
Thus, it was 14.
comedy movies are halfway between the space stand for in the graph.
D. Write equations to find the number of students who choose comedy movies.
Answer:
The number of students who choose comedy=X
It is between 12 and 16.
each space stands for 4 students.
the numbers between 12 and 16 are 13, 14, 15
The mark is above the number 12 and it is halfway.
Thus, it was 14.
According to the bar graph given above, the students who choose comedy movies are 14
This can be written as:
X=14
It is an equation, X is a variable that represents the unknown value.
E. How can you find how many fewer students choose comedy movies than family movies?
Answer:
the number of students who choose family movies is 20
The number of students who choose comedy movies is 14
The number of fewer students who choose comedy movies than family movies=X
X=20-14
X=6
Therefore, 6 fewer students choose comedy movies than family movies.
Check Understanding
Use the bar graph above.
Question 1.
How many more students choose comedy than hero movies?
Answer:
The number of students who choose comedy movies is 14
The number of students who choose hero movies is 10
It is between 8 and 12
And it is halfway, so it is 10.
The number of more students who choose comedy than hero movies=X
X=14-10
X=4
Therefore, 4 more students choose comedy than hero movies.
Question 2.
How many fewer students choose tales than family movies?
Answer:
The number of students who choose family movies is 20
the number of students who choose tales is 12
The number of fewer students who choose tales than family movies=X
X=20-12
X=8
therefore, 8 fewer students choose tales than family movies.
On Your Own
Use Structure Use the bar graph for 3-7,
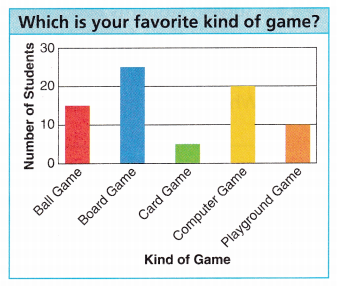
Yee surveys students about which kind of game is their favourite.
Question 3.
How many students does Yee survey?
Answer:
The number of students doing yee survey is 30.
According to the bar graph, the number of students is 30
Question 4.
Which kind of game does the greatest number of students choose?
Answer: Boardgame.
According to the bar graph, the board game has 25 students.
Boardgame has the greatest number of students because each student space is 10.
The board game is between 20 and 30 and it is halfway.
Thus, 25 students choose board games.
Question 5.
How many more students choose computer game than ball game?
Answer:
the number of students who choose computer game=20
The number of students who choose ball game=15
The number of more students who choose computer game and ball game=X
X=20-15
X=5
Therefore, 5 more students choose computer game and ball game.
Question 6.
How many fewer students choose card games than computer game?
Answer:
The number of students who choose card game=5
The number of students who choose computer game=20
The number of fewer students who choose card game than computer game=X
x=20-5
X=5
Therefore, 5 fewer students choose card games than a computer game.
Question 7.
The model with Mathematics if the scale showed counting by 2s, how would the bars change?
Answer:
The number of values on the X-axis of a bar graph or the y-axis of a column graph is called the scale.
The scale is a way to show how many items are in a set.
Now the scale will be starting from 0, 2, 4,6, 8,10, 12, 14, 16, 18, 20, 22, 24, 26, 28, 30.
I’m in a Learning Mindset!
How am I adjusting to the idea of displaying data in bar graphs instead of picture graphs?
Answer:
– It shows quantities represented by horizontal or vertical bars and is useful for displaying:
– The activity of one thing through time.
– several categories of results at once.
– Data sets with few observations.
– standard deviations must be displayed using a deviation bar, extending beyond the top of the data bar.