We included HMH Into Math Grade 3 Answer Key PDF Module 18 Review to make students experts in learning maths.
HMH Into Math Grade 3 Module 18 Review Answer Key
Choose the correct term from the Vocabulary box.
Vocabulary
bar graph
key
line plot
picture graph
scale
Question 1.
A __________ is a graph that uses marks to record each piece of data on a number line.
Answer:
A line plot is a graph that uses marks to record each piece of data on a number line.
Question 2.
A ___________ helps to label a graph with equally spaced numbers.
Answer:
A scale helps to label a graph with equally spaced numbers.
Question 3.
A ___________ uses symbols to show and compare information.
Answer:
A picture graph uses symbols to show and compare information.
Concepts and Skills
Use the ribbons for 8-10.
Question 4.
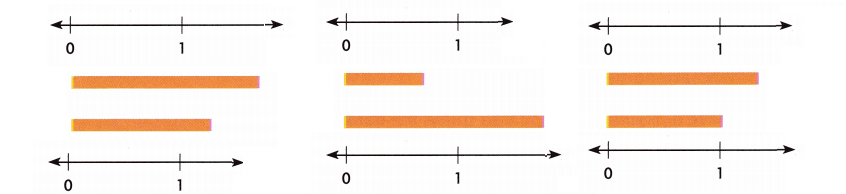
Use Tools Measure the length of each ribbon to the nearest quarter inch. Tell what strategy or tool you will use to solve the problem, explain your choice, and then find the answer.
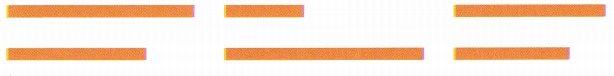
Answer:
Explanation:
I measured the lengths of the ribbons using inch ruler.
Question 5.
Make a line plot that shows the data.
![]()
Answer:
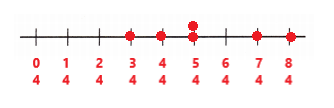
Explanation:
I made a line plot to show the data about the lengths of the ribbons.
Question 6.
How many more ribbons have a length of 1\(\frac{1}{2}\) inch and 2 inches combined than a length of \(\frac{3}{4}\) inch?
Answer:
4 more ribbons have a length of 1\(\frac{1}{2}\) inch and 2 inches combined than a length of \(\frac{3}{4}\) inch.
Use the data in the table for 6-7.
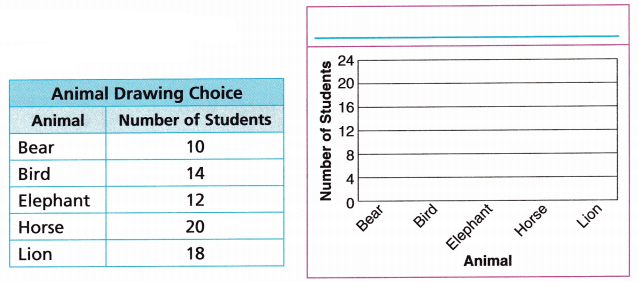
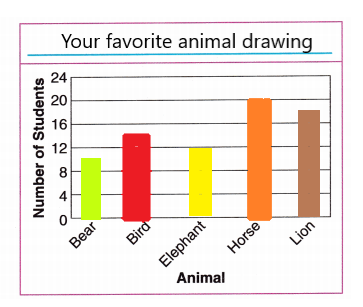
Zoe records in a table the type of animal that students in her class would like to learn how to draw.
Question 7.
Make a bar graph that represents the data.
Answer:
Explanation:
I drew a bar graph to represent the data that Zoe records .
Question 8.
How many fewer students choose bear than horse and lion combined?
(A) 10
(B) 28
(C) 38
(D) 48
Answer:
(B) 28
Explanation:
Number of students chose Bear = 10
Number of students chose Horse and Lion = 20 + 18 = 38
38 – 10 = 28
Therefore, 28 students choose bear than horse and lion combined.
Question 9.
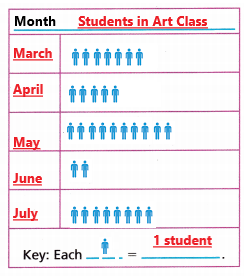
Ms. Kelly collects data about the number of students who attend her art class. Make a picture graph that shows the data in the tally chart. Choose a number greater than 1 for what the symbol represents.
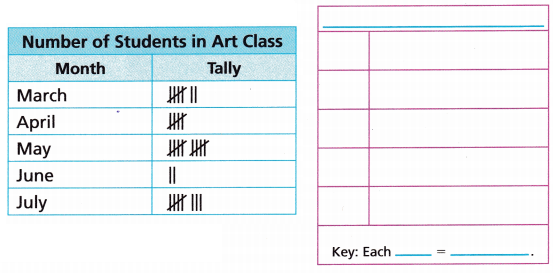
How many more students attend art class in May than in April and June combined?
Answer:
Explanation:
Number of students May = 10
Number of students in April and June = 5 + 2 = 7
10 – 7 = 3
3 more students attendd art class in May than in April and June combined.