
A Venn diagram is a graph that has closed curves especially circles to represent a set. In general, the sets are the collection of well-defined objects. The Venn diagram shows the relationship bets the sets. Circles overlap means they have common things. Venn diagrams are now used as illustrations in business and in many academic fields. Get the definition of the Venn diagram and diagrams for set operations in the following sections.
What is Venn Diagram?
A Venn diagram is a diagram used to represent the relations between various sets. A Venn diagram can be represented by any closed figure, it can be a circle or polygon. Generally, we use circles to represent one set.
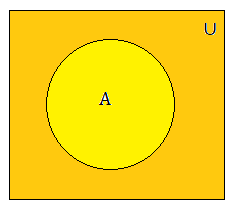
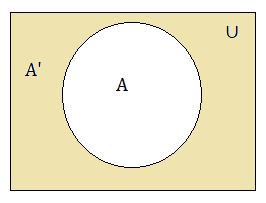
In the above diagram, circle A represents the set and the rectangle ∪ represents the universal set. It is a Venn diagram of one set. You can also draw a Venn diagram for different sets and to represent their relationships.
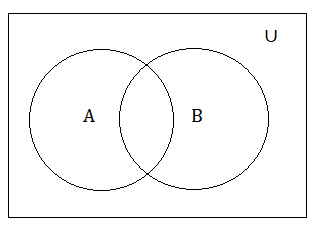
The Venn diagram for two sets is provided here.
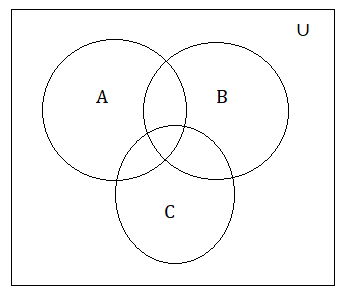
The Venn diagram for three sets is given here.
How to Draw a Venn Diagram?
Follow the below-mentioned rules and instructions to draw a Venn diagram for the sets easily.
- At first, you need to know the universal set. Every set is the subset of the universal set which is denoted by U. It states that every other set will be inside the rectangle which represents the universal set.
Venn Diagrams for Set Operations
The various set of operations in the set theory are listed here.
- Union of Sets
- Intersection of Sets
- Complement of sets
- Difference of Sets
Let us have a look at the Venn diagrams for all the set operations.
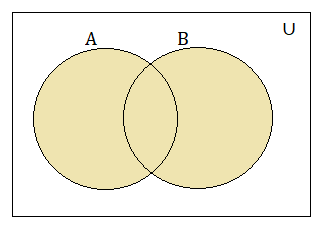
Union of Two Sets
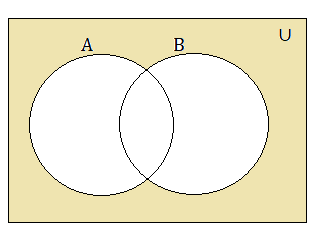
Union of two sets A and B are given as A ∪ B = {x: x ∈ A or x ∈ B}. Include all the elements of A and B to get the union.
Some of the properties of the union are
- A ∪ B = B ∪ A
- (A ∪ B) ∪ C = A ∪ (B ∪ C)
- A ∪ Φ = A
- A ∪ A = A
- U ∪ A = U
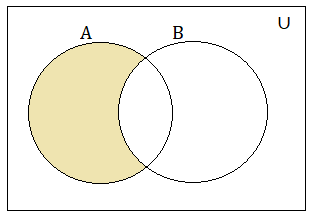
The Venn diagram for A ∪ B is given here. The shaded region represents the result set.
Complement of Sets
The complement of a set A is A’ which means {∪ – A} includes the elements of a universal set that not elements of set A.
The Venn diagram for A’ is provided below.
Complement of Union of Sets
(A ∪ B)’ means the elements which are neither in set A nor in set B. The shaded region in the Venn diagram represents the complement of A union B.
Complement of Intersection of Sets
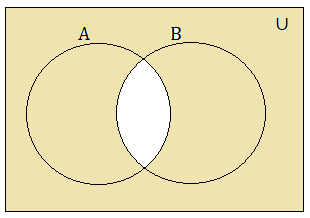
(A ∩ B)’ means the elements of the universal set which are not common between two sets A and B. The shaded region of the diagram represents the complement of A intersection B.
The Intersection of Two Sets
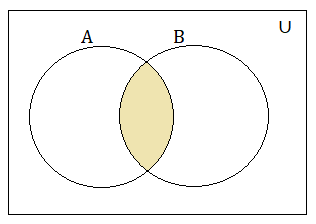
The intersection of two finite sets A and B is given as A ∩ B = {x: x ∈ A and x ∈ B}. Here, include the common elements of A and B.
The properties of set intersection are
- A ∩ B = B ∩ A
- (A ∩ B) ∩ C = A ∩ (B ∩ C)
- Φ ∩ A = Φ
- U ∩ A = A
- A ∩ A = A
- A ∩ (B ∪ C) = (A ∩ B) ∪ (A ∩ C)
- A ∪ (B ∩ C) = (A ∪ B) ∩ (A ∪ C)
Difference Between Two Sets
The difference between two sets A and B is A – B. It represents the elements of A which are not in B. The shaded region in the diagram represents the difference between the two sets.
Also, Read
Venn Diagram Questions and Answers
Question 1:
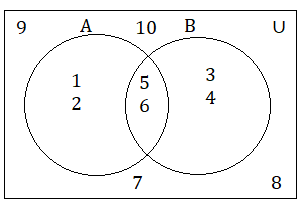
Read the Venn diagram and answer the following questions.
(a) A, B
(b) A’, B’
(c) A ∪ B, A ∩ B
(d) B – A
Solution:
From the Venn diagram, we can say that
(a) A = {1, 2, 5, 6}
B = {3, 4, 5, 6}
(b) A’ = U – A
= {1, 2, 3, 4, 5, 6, 7, 8, 9, 10} – {1, 2, 5, 6}
= {3, 4, 7, 8, 9, 10}
B’ = U – B
= {1, 2, 3, 4, 5, 6, 7, 8, 9, 10} – {3, 4, 5, 6}
= {1, 2, 7, 8, 9, 10}
(c) A ∪ B = {1, 2, 5, 6} ∪ {3, 4, 5, 6}
= {1, 2, 3, 4, 5, 6}
A ∩ B = {1, 2, 5, 6} ∩ {3, 4, 5, 6}
= {5, 6}
(d) B – A = {3, 4, 5, 6} – {1, 2, 5, 6}
= {3, 4}
Question 2:
Draw Venn diagrams to show the relationship between the following pairs of sets.
(i) A = {All girls in the School}
B = {All girls in the class}
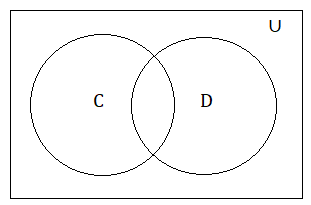
(ii) C = {First 10 multiples of 5}
D = {First 10 multiples of 3}
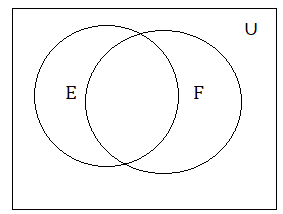
(iii) E = {x : x is an odd number, less than 20}
F = {x : x is a prime number, less than 20}
Solution:
(i) 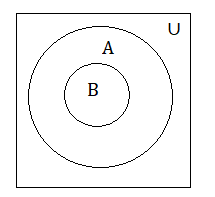
(ii) The first 10 multiples of 5 are C = {5, 10, 15, 20, 25, 30, 35, 40, 45, 50}
The first 10 multiples of 3 are D = {3, 6, 9, 12, 15, 18, 21, 24, 27, 30}
(iii) The set of odd numbers less than 20 are E = {1, 3, 5, 7, 9, 11, 13, 15, 17, 19}
The set of prime numbers less than 20 are F = {1, 2, 3, 5, 7, 11, 13, 17, 19}
Question 3:
What set is represented by the shaded portion in the following Venn diagrams?
(a) 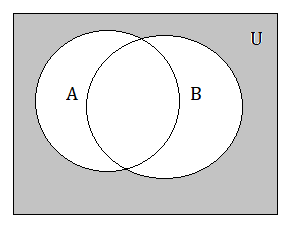
(b) 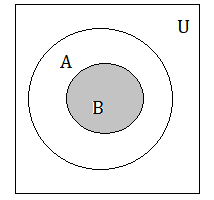
(c) 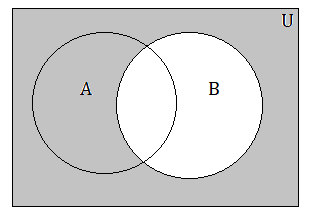
(d) 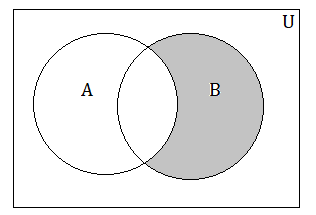
(e) 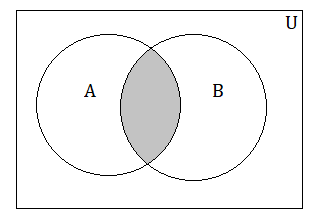
Solution:
The representation of sets for the shaded regions is given here.
(a) A U B means both sets are shaded.
(A U B)’
(b) B is a proper subset of A
B ⊂ A.
(c) A ∩ B’
(d) B – A
(e) A ∩ B
Frequently Asked Questions on Venn Diagrams
1. What is a Venn Diagram?
A Venn diagram is the pictorial representation of sets. It shows the relationship between two or more mathematical sets.
2. If a Venn diagram shows two circles which do not touch each other, then what does it mean?
In a Venn diagram, if two circles in a rectangle show that two independent sets. And those sets don’t intersect at any point means they are disjoint sets.
3. What are the applications of a Venn Diagram?
Venn Diagrams are used to describe how items relate to each other against a universe, environment or data set. A Venn diagram can be used to compare two companies within the same industry by illustrating the products.
4. Why are they called Venn Diagrams?
They are called Venn Diagrams because those diagrams were developed by John Venn an English logician. So, in the name of the logician, they are called Venn Diagrams.
5. How do you read a Venn Diagram?
A Venn diagram can be read by all circles in the whole diagram. Each circle is a set. The portions of circles overlap mean that area is common amongst the different elements. if portions do not overlap means unique elements.