Students can use the Spectrum Math Grade 8 Answer Key Chapter 6 Lesson 6.5 Frequency Tables as a quick guide to resolve any of their doubts
Spectrum Math Grade 8 Chapter 6 Lesson 6.5 Frequency Tables Answers Key
Mr. Park’s class got the following scores on a recent test: 85, 88, 92, 72, 95, 84, 84, 82, 97, 67, 90, 84, 87, 90, 78, 80, 88, 90, 84, 78. He made this frequency table with the scores.
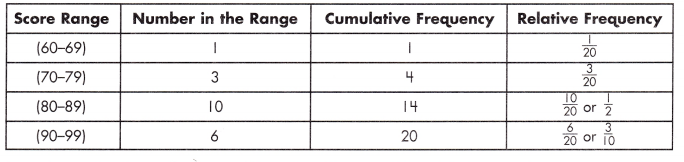
The chart shows that the scores ranged from the 60s to the 90s, with the most frequent scores in the 80s range. The relative frequency compares the number in each range with the total number of scores.
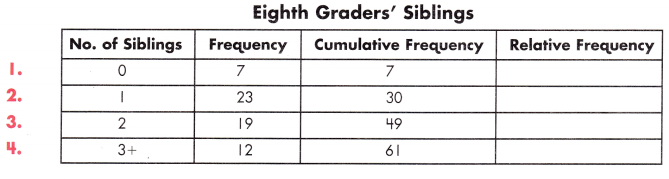
Complete the chart with fractions in simplest form. Then, answer the questions.
Answer:
Explanation:
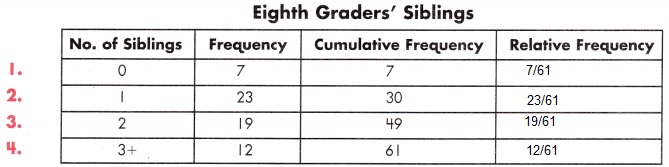
The above chart shows that the Eighth grade sibling’s ranged from 0 to 3+ with the most frequent scores in the age group of 1 range.
The relative frequency compares the number in each range with the total number of scores.
The total number of sibling’s of all age groups in eighth grade are 61.
Question 5.
How many 8th graders were polled?
Answer:
61
Explanation:
The above chart shows that the Eighth grade sibling’s ranged from 0 to 3+
The total number of 8th graders were polled are 61.
Question 6.
How many different options were the students given to choose from?
Answer:
4
Explanation:
The above chart shows that the Eighth grade sibling’s ranged from 0 to 3+
So, there are four different options which were given to the students to choose from.
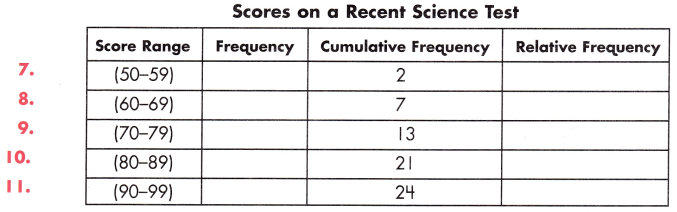
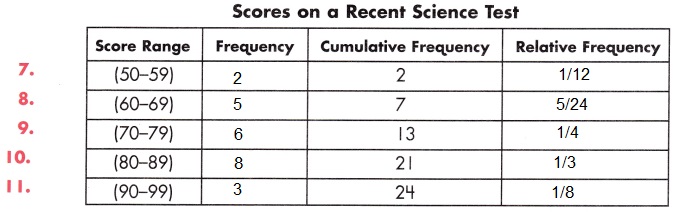
Complete the chart with the missing numbers. Then, answer the questions.
Answer:
Explanation:
The above chart shows that the scores ranged from the 50s to the 99s, with the most frequent scores in the 80s range.
The relative frequency compares the number in each range with the total number of scores.
The total number of scores are 24.
Question 12.
In what 10-point range did the most students score?
Answer:
80 – 89
Explanation:
The above chart shows that the scores ranged from the 50s to the 99s, with the most frequent scores in the 80s – 89s range.
Question 13.
What was the total range of points students could have received on the test?
Answer:
50 – 99
Explanation:
The above chart shows that the scores ranged from the 50s to the 99s,
with the most frequent scores in the 80s range.
The total range of points students could have received on the test between 50 – 99.
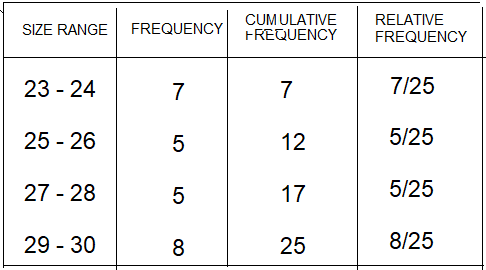
Use the data sets to complete the frequency table and answer the questions.
Radar was used to record the speed of cars traveling through downtown as follows: 29, 23, 30, 30, 27, 24, 30, 25, 23, 28, 25, 24, 28, 30, 23, 30, 27, 25, 29, 24, 23, 26, 30, 28, and 25.
Question 1.
Speed Range: 23-24
Frequency: ______________
Cumulative: ______________
Relative Frequency: ______________
Answer:
Frequency: 7
Cumulative: 7
Relative Frequency: 7/25
Explanation:
The below chart shows that the speeds ranged from 23 to 30.
Frequency:
Frequency is the number of occurrences of a repeating event per unit of time.
23 repeats 4 times
24 repeats 3 times
for the range 23 – 24 frequency is (4 + 3) = 7
Cumulative Frequency:
cumulative frequency is the sum of all the frequencies before the size range
0 + 7 = 7
Relative Frequency:
The relative frequency compares the number in each range with the total number of scores.
frequency of the given range ÷ total number of observations = 7/25
Question 2.
Speed Range: 25-26
Frequency: ______________
Cumulative: ______________
Relative Frequency: ______________
Answer:
Frequency: 5
Cumulative: 12
Relative Frequency: 1/5
Explanation:
The below chart shows that the speeds ranged from 23 to 30.
Frequency:
Frequency is the number of occurrences of a repeating event per unit of time.
25 repeats 4 times
26 repeats 1 time
for the range 25 – 26 frequency is (4 + 1) = 5
Cumulative Frequency:
cumulative frequency is the sum of all the frequencies before the size range.
7 + 5 = 12
Relative Frequency: 1/5
frequency of the given range ÷ total number of observations.
5/25 = 1/5
Question 3.
Speed Range: 27-28
Frequency: ______________
Cumulative: ______________
Relative Frequency: ______________
Answer:
Frequency: 5
Cumulative: 17
Relative Frequency: 1/5
Explanation:
The below chart shows that the speeds ranged from 23 to 30.
Frequency:
Frequency is the number of occurrences of a repeating event per unit of time.
27 repeats 2 times
28 repeats 3 times
for the range 27 – 28 frequency is (2 + 3) = 5
Cumulative Frequency:
cumulative frequency is the sum of all the frequencies before the size range.
12 + 7 = 19
Relative Frequency: 1/5
frequency of the given range ÷ total number of observations.
5/25 = 1/5
Question 4.
Speed Range: 29-30
Frequency: ______________
Cumulative: ______________
Relative Frequency: ______________
Answer:
Frequency: 8
Cumulative: 25
Relative Frequency: 8/25
Explanation:
The below chart shows that the speeds ranged from 23 to 30.
Frequency:
Frequency is the number of occurrences of a repeating event per unit of time.
29 repeats 2 times
30 repeats 6 times
for the range 29 – 30 frequency is (2 + 6) = 8
Cumulative Frequency:
cumulative frequency is the sum of all the frequencies before the size range.
17 + 8 = 25
Relative Frequency: 8/25
frequency of the given range ÷ total number of observations = 8/25
Question 5.
At what speed were most cars driving?
Answer:
29 – 30
Explanation:
The below chart shows that the speeds ranged from the 23 to 30, with the most frequent scores in the 29 – 30 range.
So, the frequency of 29 – 30 is the highest = 8
Question 6.
In which two speed ranges were the same number of cars driving?
Answer:
25 – 26 and 27 – 28
Explanation:
The above chart shows that the speed ranged from the 23 to 30.
The frequency of 25 – 26 and 27 – 28 are same which is 5.
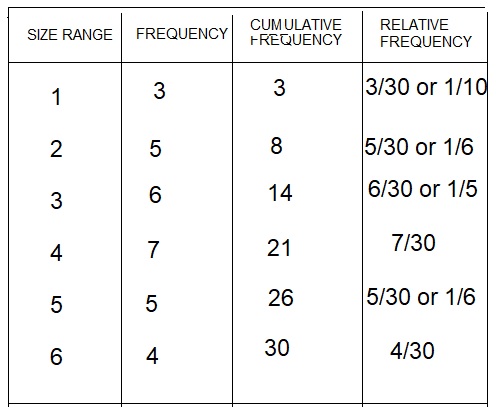
One die was rolled with the following results: 6, 5, 4, 4, 5, 6, 1, 2, 1, 6, 4, 3, 3, 3, 4, 2, 2, 5, 6, 4, 1, 2, 4, 3, 5, 5, 3, 3, 4, and 2.
Question 7.
Roll: 1
Frequency: ______________
Cumulative Frequency: ______________
Relative Frequency: ______________
Answer:
Frequency: 3
Cumulative: 3
Relative Frequency: 1/10
Explanation:
The below chart shows that One die was rolled with the following results:
The scores ranged from the 1 to the 6, with the most frequent scores in the 4 range.
Frequency:
Frequency is the number of occurrences of a repeating event per unit of time.
Roll: 1 in die repeats 3 times.
for the range 1 frequency is 3.
Cumulative Frequency:
cumulative frequency is the sum of all the frequencies before the size range.
0 + 3 = 3
Relative Frequency:
frequency of the given range ÷ total number of observations.
3/30 = 1/10
Question 8.
Roll: 2
Frequency: ______________
Cumulative Frequency: ______________
Relative Frequency: ______________
Answer:
Frequency: 5
Cumulative: 8
Relative Frequency: 1/6
Explanation:
The below chart shows that One die was rolled with the following results:
The scores ranged from the 1 to the 6, with the most frequent scores in the 4 range.
Frequency:
Frequency is the number of occurrences of a repeating event per unit of time.
Roll: 2 in die repeats 5 times.
for the range 2 frequency is 5.
Cumulative Frequency:
cumulative frequency is the sum of all the frequencies before the size range.
3 + 5 = 8
Relative Frequency:
frequency of the given range ÷ total number of observations.
5/30 = 1/6
Question 9.
Roll: 3
Frequency: ______________
Cumulative Frequency: ______________
Relative Frequency: ______________
Answer:
Frequency: 6
Cumulative: 14
Relative Frequency: 1/5
Explanation:
The below chart shows that One die was rolled with the following results:
The scores ranged from the 1 to the 6, with the most frequent scores in the 4 range.
Frequency:
Frequency is the number of occurrences of a repeating event per unit of time.
Roll: 3 in die repeats 6 times.
for the range 3 frequency is 6.
Cumulative Frequency:
cumulative frequency is the sum of all the frequencies before the size range.
8 + 6 = 14
Relative Frequency:
frequency of the given range ÷ total number of observations.
6/30 = 1/5
Question 10.
Roll: 4
Frequency: ______________
Cumulative Frequency: ______________
Relative Frequency: ______________
Answer:
Frequency: 7
Cumulative: 21
Relative Frequency: 7/30
Explanation:
The below chart shows that One die was rolled with the following results:
The scores ranged from the 1 to the 6, with the most frequent scores in the 4 range.
Frequency:
Frequency is the number of occurrences of a repeating event per unit of time.
Roll: 4 in die repeats 7 times.
for the range 4 frequency is 7.
Cumulative Frequency:
cumulative frequency is the sum of all the frequencies before the size range.
14 + 7 = 21
Relative Frequency:
frequency of the given range ÷ total number of observations = 7/30
Question 11.
Roll: 5
Frequency: ______________
Cumulative Frequency: ______________
Relative Frequency: ______________
Answer:
Frequency: 5
Cumulative: 26
Relative Frequency: 1/6
Explanation:
The below chart shows that One die was rolled with the following results:
The scores ranged from the 1 to the 6, with the most frequent scores in the 4 range.
Frequency:
Frequency is the number of occurrences of a repeating event per unit of time.
Roll: 5 in die repeats 5 times.
for the range 5 frequency is 5
Cumulative Frequency:
cumulative frequency is the sum of all the frequencies before the size range.
21 + 5 = 26
Relative Frequency:
frequency of the given range ÷ total number of observations.
5/30 = 1/6
Question 12.
Roll: 6
Frequency: ______________
Cumulative Frequency: ______________
Relative Frequency: ______________
Answer:
Frequency: 4
Cumulative: 30
Relative Frequency: 2/15
Explanation:
The below chart shows that One die was rolled with the following results:
The scores ranged from the 1 to the 6, with the most frequent scores in the 4 range.
Frequency:
Frequency is the number of occurrences of a repeating event per unit of time.
Roll: 6 in die repeats 4 times.
for the range 1 frequency is 4.
Cumulative Frequency:
cumulative frequency is the sum of all the frequencies before the size range.
26 + 4 = 30
Relative Frequency:
frequency of the given range ÷ total number of observations.
4/30 = 2/15
Question 13.
How many times was the die rolled?
Answer:
30
Explanation:
From the above information given die was rolled for 30 times.
Question 14.
Which number was rolled most frequently?
Answer:
4
Explanation:
The below chart shows that One die was rolled with the following results:
The scores ranged from the 1 to the 6, with the most frequent scores in the 4 range.
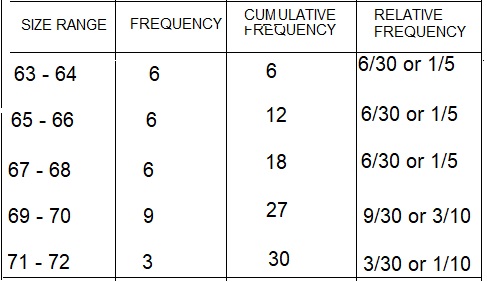
The heights of students in inches are as follows: 66, 68, 65, 70, 67, 64, 70, 64, 66, 70, 72, 71, 69, 69, 64, 67, 63, 70, 71,63, 68, 67, 65, 69, 65, 67, 66, 69, 64, and 69.
Question 15.
Height Range: 63-64
Frequency: ______________
Cumulative Frequency: ______________
Relative Frequency: ______________
Answer:
Frequency: 6
Cumulative: 6
Relative Frequency: 1/5
Explanation:
The below chart shows that the heights of students in inches are as follows,
The heights ranged from the 63 inches to the 72 inches, with the most frequent heights in the 69 to 70 inches range.
Frequency:
Frequency is the number of occurrences of a repeating event per unit of time.
63 inches repeats 2 times
64 inches repeats 4 times
for the range 63 – 64 frequency is (2 + 4) = 6
Cumulative Frequency:
cumulative frequency is the sum of all the frequencies before the size range.
0 + 6 = 6
Relative Frequency:
frequency of the given range ÷ total number of observations.
6/30 = 1/5
Question 16.
Height Range: 65-66
Frequency: ______________
Cumulative Frequency: ______________
Relative Frequency: ______________
Answer:
Frequency: 6
Cumulative: 12
Relative Frequency: 1/5
Explanation:
The below chart shows that the heights of students in inches are as follows,
The heights ranged from the 63 inches to the 72 inches, with the most frequent heights in the 69 to 70 inches range.
Frequency:
Frequency is the number of occurrences of a repeating event per unit of time.
65 inches repeats 3 times
66 inches repeats 3 times
for the range 65 – 66 frequency is (3 + 3) = 6
Cumulative Frequency:
cumulative frequency is the sum of all the frequencies before the size range.
6 + 6 = 12
Relative Frequency:
frequency of the given range ÷ total number of observations.
6/30 = 1/5
Question 17.
Height Range: 67-68
Frequency: ______________
Cumulative Frequency: ______________
Relative Frequency: ______________
Answer:
Frequency: 6
Cumulative: 18
Relative Frequency: 1/5
Explanation:
The below chart shows that the heights of students in inches are as follows,
The heights ranged from the 63 inches to the 72 inches, with the most frequent heights in the 69 to 70 inches range.
Frequency:
Frequency is the number of occurrences of a repeating event per unit of time.
67 inches repeats 4 times
68 inches repeats 2 times
for the range 67 – 68 frequency is (4 + 2) = 6
Cumulative Frequency:
cumulative frequency is the sum of all the frequencies before the size range.
12 + 6 = 18
Relative Frequency:
frequency of the given range ÷ total number of observations.
6/30 = 1/5
Question 18.
Height Range: 69-70
Frequency: ______________
Cumulative Frequency: ______________
Relative Frequency: ______________
Answer:
Frequency: 9
Cumulative: 27
Relative Frequency: 3/10
Explanation:
The below chart shows that the heights of students in inches are as follows,
The heights ranged from the 63 inches to the 72 inches, with the most frequent heights in the 69 to 70 inches range.
Frequency:
Frequency is the number of occurrences of a repeating event per unit of time.
69 inches repeats 5 times
70 inches repeats 4 times
for the range 69 – 70 frequency is (5 + 4) = 9
Cumulative Frequency:
cumulative frequency is the sum of all the frequencies before the size range.
18 + 9 = 27
Relative Frequency:
frequency of the given range ÷ total number of observations.
9/30 = 3/10
Question 19.
Height Range: 71-72
Frequency: ______________
Cumulative Frequency: ______________
Relative Frequency: ______________
Answer:
Frequency: 3
Cumulative: 30
Relative Frequency: 1/10
Explanation:
The below chart shows that the heights of students in inches are as follows,
The heights ranged from the 63 inches to the 72 inches, with the most frequent heights in the 69 to 70 inches range.
Frequency:
Frequency is the number of occurrences of a repeating event per unit of time.
71 inches repeats 2 times
72 inches repeats 1 time
for the range 71 – 72 frequency is (2 + 1) = 3
Cumulative Frequency:
cumulative frequency is the sum of all the frequencies before the size range.
27 + 3 = 30
Relative Frequency:
frequency of the given range ÷ total number of observations.
3/30 = 1/10
Question 20.
At what height are most students?
Answer:
69 – 70
Explanation:
The above given information shows that the heights of students in inches.
The heights ranged from the 63 inches to the 72 inches, with the most frequent heights in the 69 to 70 inches range.
Question 21.
How many students were measured?
Answer:
30
Explanation:
The above given information shows that the heights of students in inches.
The heights of 30 students were measured.
Use the data sets to complete the frequency table and answer the questions.
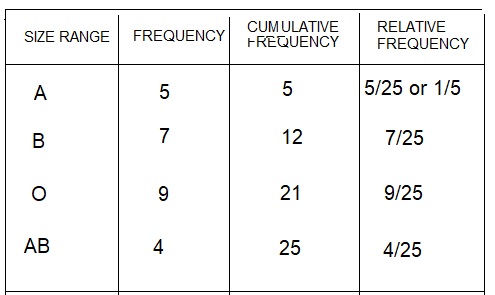
At a blood drive, the blood types of the donors is tracked as follows: A, B, B, AB, O, O, O, B, AB, B, B, B, O, A, O, A, O, O, O, AB, AB, A, O, B, and A.
Question 1.
Blood Type: A
Frequency: ______________
Cumulative Frequency: ______________
Relative Frequency: ______________
Answer:
Frequency: 5
Cumulative: 5
Relative Frequency: 1/5
Explanation:
The below chart shows that the blood drive,
the blood types of the donors is tracked as follows:
The blood type of donors ranged from A to AB, with the most frequent donors in O group.
Frequency:
Frequency is the number of occurrences of a repeating event per unit of time.
Blood donors in A repeats 5 times.
So, frequency in A is 5.
Cumulative Frequency:
cumulative frequency is the sum of all the frequencies before the size range.
0 + 5 = 5
Relative Frequency:
frequency of the given range ÷ total number of observations.
5/25 = 1/5
Question 2.
Blood Type: B
Frequency: ______________
Cumulative Frequency: ______________
Relative Frequency: ______________
Answer:
Frequency: 7
Cumulative: 12
Relative Frequency: 7/25
Explanation:
The below chart shows that the blood drive,
the blood types of the donors is tracked as follows:
The blood type of donors ranged from A to AB, with the most frequent donors in O group.
Frequency:
Frequency is the number of occurrences of a repeating event per unit of time.
Blood donors in B repeats 7 times.
So, frequency in B is 7.
Cumulative Frequency:
cumulative frequency is the sum of all the frequencies before the size range.
5 + 7 = 12
Relative Frequency:
frequency of the given range ÷ total number of observations = 7/25
Question 3.
Blood Type: O
Frequency: ______________
Cumulative Frequency: ______________
Relative Frequency: ______________
Answer:
Frequency: 9
Cumulative: 21
Relative Frequency: 9/25
Explanation:
The below chart shows that the blood drive,
the blood types of the donors is tracked as follows:
The blood type of donors ranged from A to AB, with the most frequent donors in O group.
Frequency:
Frequency is the number of occurrences of a repeating event per unit of time.
Blood donors in O repeats 9 times.
So, frequency in O is 9.
Cumulative Frequency:
cumulative frequency is the sum of all the frequencies before the size range.
12 + 9 = 21
Relative Frequency:
frequency of the given range ÷ total number of observations = 9/25
Question 4.
Blood Type: AB
Frequency: ______________
Cumulative Frequency: ______________
Relative Frequency: ______________
Answer:
Frequency: 4
Cumulative: 25
Relative Frequency: 4/25
Explanation:
The below chart shows that the blood drive,
the blood types of the donors is tracked as follows:
The blood type of donors ranged from A to AB, with the most frequent donors in O group.

Frequency:
Frequency is the number of occurrences of a repeating event per unit of time.
Blood donors in AB repeats 4 times.
So, frequency in AB is 4.
Cumulative Frequency:
cumulative frequency is the sum of all the frequencies before the size range.
21 + 4 = 25
Relative Frequency:
frequency of the given range ÷ total number of observations = 4/25
Question 5.
Which blood type was most common?
Answer:
O
Explanation:
From the above given information of the blood drive,
when the blood types of the donors is tracked from A to AB, with the most frequent donors in O group.
Question 6.
How many donors came to the blood drive?
Answer:
25
Explanation:
From the above given information of the blood drive,
the number of donors from A to AB blood types are 25.
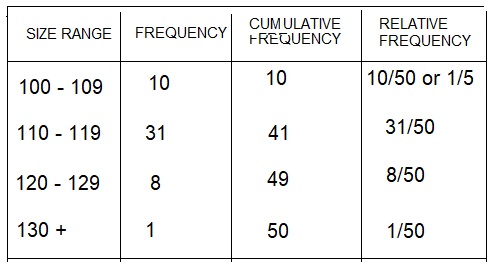
Record high temperatures from around the country are recorded as follows: 112, 100, 127, 120,134, 118, 105, 110, 109, 112, 110, 118, 117, 116, 118, 122, 114, 114, 105, 109, 107, 112, 114, 115, 118, 117, 118, 122, 106, 110, 116, 108, 110, 121, 113, 120, 119, 111, 104, 111, 120, 113, 120, 117, 105, 110, 118, 112, 114, and 114.
Question 7.
Temp. Range: 100-109
Frequency: ______________
Cumulative Frequency: _______________
Relative Frequency: _______________
Answer:
Frequency: 10
Cumulative: 10
Relative Frequency: 1/5
Explanation:
The below chart shows that the Record high temperatures from around the country are recorded as follows:
The Record high temperatures ranged from 100 to 130+, with the most frequent 110 – 119 range.
Frequency:
Frequency is the number of occurrences of a repeating event per unit of time.
The Record high temperatures from 100 – 109 degrees Celsius repeats 10 times.
The frequency range from 100 – 109 is 10.
Cumulative Frequency:
cumulative frequency is the sum of all the frequencies before the size range.
0 + 10 = 10
Relative Frequency:
frequency of the given range ÷ total number of observations.
10/50 = 1/5
Question 8.
Temp. Range: 110-119
Frequency: ______________
Cumulative Frequency: _______________
Relative Frequency: _______________
Answer:
Frequency: 31
Cumulative: 41
Relative Frequency: 31/50
Explanation:
The below chart shows that the Record high temperatures from around the country are recorded as follows:
The Record high temperatures ranged from 100 to 130+, with the most frequent 110 – 119 range.
Frequency:
Frequency is the number of occurrences of a repeating event per unit of time.
The Record high temperatures from 110 – 119 degrees Celsius repeats 31 times.
The frequency range from 110 – 119 is 31.
Cumulative Frequency:
cumulative frequency is the sum of all the frequencies before the size range.
10 + 31 = 41
Relative Frequency:
frequency of the given range ÷ total number of observations = 31/50
Question 9.
Temp. Range: 120-129
Frequency: ______________
Cumulative Frequency: _______________
Relative Frequency: _______________
Answer:
Frequency: 8
Cumulative: 49
Relative Frequency: 4/25
Explanation:
The below chart shows that the Record high temperatures from around the country are recorded as follows:
The Record high temperatures ranged from 100 to 130+, with the most frequent 110 – 119 range.
Frequency:
Frequency is the number of occurrences of a repeating event per unit of time.
The Record high temperatures from 120 – 129 degrees Celsius repeats 8 times.
The frequency range from 120 – 129 is 8.
Cumulative Frequency:
cumulative frequency is the sum of all the frequencies before the size range.
41 + 8 = 49
Relative Frequency:
frequency of the given range ÷ total number of observations.
8/50 or 4/25
Question 10.
Temp. Range: 130+
Frequency: ______________
Cumulative Frequency: _______________
Relative Frequency: _______________
Answer:
Frequency: 1
Cumulative: 50
Relative Frequency: 1/50
Explanation:
The below chart shows that the Record high temperatures from around the country are recorded as follows:
The Record high temperatures ranged from 100 to 130+, with the most frequent 110 – 119 range.
Frequency:
Frequency is the number of occurrences of a repeating event per unit of time.
The Record high temperatures from 130+ degrees Celsius is only once.
Cumulative Frequency:
cumulative frequency is the sum of all the frequencies before the size range.
49 + 1 = 50
Relative Frequency:
frequency of the given range ÷ total number of observations = 1/50
Question 11.
What was the most common temperature range?
Answer:
110 – 119
Explanation:
From the above given information of the Record high temperatures from around the country are ranged from 100 to 130+, with the most frequent 110 – 119 range as 31 times.
Question 12.
What was the least common temperature range?
Answer:
130+
Explanation:
From the above given information of the Record high temperatures from around the country are ranged from 100 to 130+, the least common temperature range is 130+.
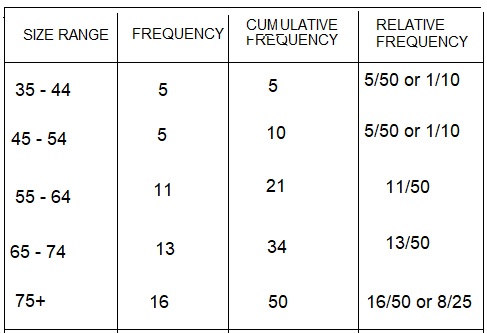
The ages of the 50 wealthiest people in the USA are: 49, 57, 38, 73, 8 1,74, 59, 76, 65, 69, 54, 56, 69, 68, 78, 65, 85, 49, 69, 61, 48, 81,68, 37, 43, 78, 82, 43, 64, 67, 52, 56, 81,79, 85, 40, 85, 85, 59, 80, 60, 71,57, 61,69, 61, 83, 90, 87, and 74.
Question 13.
Age Range: 35-44
Frequency: ______________
Cumulative Frequency: _______________
Relative Frequency: ______________
Answer:
Frequency: 5
Cumulative: 5
Relative Frequency: 1/10
Explanation:
The below chart shows that the ages of the 50 wealthiest people in the USA.
The ages ranged from 35 to 75, with the most frequent ages in the 75+ range.
Frequency:
Frequency is the number of occurrences of a repeating event per unit of time.
The ages ranged from 35 to 44 is 5 members.
So, the frequency from 35 – 44 is 5.
Cumulative Frequency:
cumulative frequency is the sum of all the frequencies before the size range.
0 + 5 = 5
Relative Frequency:
frequency of the given range ÷ total number of observations.
5/50 = 1/10
Question 14.
Age Range: 45-54
Frequency: ______________
Cumulative Frequency: _______________
Relative Frequency: ______________
Answer:
Frequency: 5
Cumulative: 10
Relative Frequency: 1/10
Explanation:
The below chart shows that the ages of the 50 wealthiest people in the USA.
The ages ranged from 35 to 75, with the most frequent ages in the 75+ range.
Frequency:
Frequency is the number of occurrences of a repeating event per unit of time.
The ages ranged from 45 to 54 is 5 members.
So, the frequency from 45 – 54 is 5.
Cumulative Frequency:
cumulative frequency is the sum of all the frequencies before the size range.
5 + 5 = 10
Relative Frequency:
frequency of the given range ÷ total number of observations.
5/50 = 1/10
Question 15.
Age Range: 55-64
Frequency: ______________
Cumulative Frequency: _______________
Relative Frequency: ______________
Answer:
Frequency: 11
Cumulative: 21
Relative Frequency: 11/50
Explanation:
The below chart shows that the ages of the 50 wealthiest people in the USA.
The ages ranged from 35 to 75, with the most frequent ages in the 75+ range.
Frequency:
Frequency is the number of occurrences of a repeating event per unit of time.
The ages ranged from 55 to 64 is 11 members.
So, the frequency from 55 – 64 is 11.
Cumulative Frequency:
cumulative frequency is the sum of all the frequencies before the size range.
10 + 11 = 21
Relative Frequency:
frequency of the given range ÷ total number of observations = 11/50
Question 16.
Age Range: 65-74
Frequency: ______________
Cumulative Frequency: _______________
Relative Frequency: ______________
Answer:
Frequency: 13
Cumulative: 34
Relative Frequency: 13/50
Explanation:
The below chart shows that the ages of the 50 wealthiest people in the USA.
The ages ranged from 35 to 75, with the most frequent ages in the 75+ range.
Frequency:
Frequency is the number of occurrences of a repeating event per unit of time.
The ages ranged from 65 to 74 is 13 members.
So, the frequency from 65 – 74 is 13.
Cumulative Frequency:
cumulative frequency is the sum of all the frequencies before the size range.
21 + 13 = 34
Relative Frequency:
frequency of the given range ÷ total number of observations = 13/50
Question 17.
Age Range: 75+
Frequency: ______________
Cumulative Frequency: _______________
Relative Frequency: ______________
Answer:
Frequency: 16
Cumulative: 50
Relative Frequency: 8/25
Explanation:
The below chart shows that the ages of the 50 wealthiest people in the USA.
The ages ranged from 35 to 75, with the most frequent ages in the 75+ range.
Frequency:
Frequency is the number of occurrences of a repeating event per unit of time.
The ages ranged 75+ is 16 members.
So, the frequency of 75+ is 16.
Cumulative Frequency:
cumulative frequency is the sum of all the frequencies before the size range.
34 + 16 = 50
Relative Frequency:
frequency of the given range ÷ total number of observations.
16/50 = 8/25
Question 18.
What is the largest age group of wealthy people?
Answer:
75+
Explanation:
The information given above shows that the ages of the 50 wealthiest people in the USA.
The largest age group of wealthy people are above 75+ range.
Question 19.
What is the age difference between the oldest person and the youngest?
Answer:
53
Explanation:
The information given above shows that the ages of the 50 wealthiest people in the USA.
The age difference between the oldest person and the youngest 53 members.