Students can use the Spectrum Math Grade 8 Answer Key Chapter 6 Lesson 6.2 Constructing Scatter Plots as a quick guide to resolve any of their doubts
Spectrum Math Grade 8 Chapter 6 Lesson 6.2 Constructing Scatter Plots Answers Key
A scatter plot is a way of displaying bivariate data, or two sets of data. A scatter plot can show the relationship between the bivariate data. Scatter plots can show if the values increase or decrease relative to each other and if there are any outliers in the data.

Step 1: Set up the x-axis of a graph with intervals for one set of the data and the y-axis for the other set.
Step 2: Use the data sets as ordered pairs to create points on the scatter plot.
Use the data sets below to create scatter plots.
Question 1.
a.

Answer:
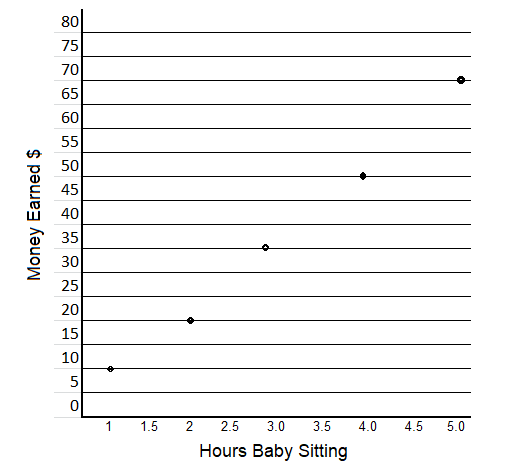
Explanation:
Step 1: Set up the x-axis of a graph with intervals for one set of the data and the y-axis for the other set.
Point number of hours baby sitting on x-axis and Money earned on the y-axis as shown above chart.
Step 2: Use the data sets as ordered pairs to create points on the scatter plot.
All the points are marked on the plot.
b.

Answer:
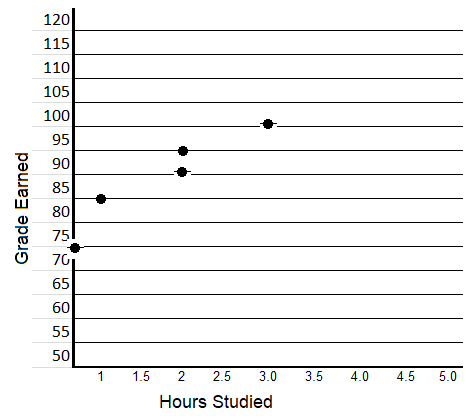
Explanation:
Step 1: Set up the x-axis of a graph with intervals for one set of the data and the y-axis for the other set.
Point number of hours studied on x-axis and Grade earned on the y-axis as shown in above chart.
Step 2: Use the data sets as ordered pairs to create points on the scatter plot.
All the points are marked on the plot.
Question 2.
a.

Answer:
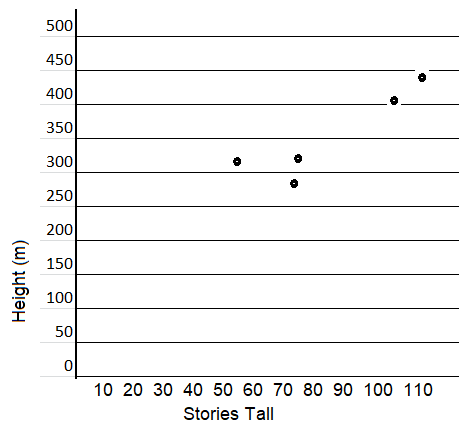
Explanation:
Step 1: Set up the x-axis of a graph with intervals for one set of the data and the y-axis for the other set.
Point number of stories on x-axis and Heights on the y-axis as shown above.
Step 2: Use the data sets as ordered pairs to create points on the scatter plot.
All the points are marked on the plot.
b.

Answer:
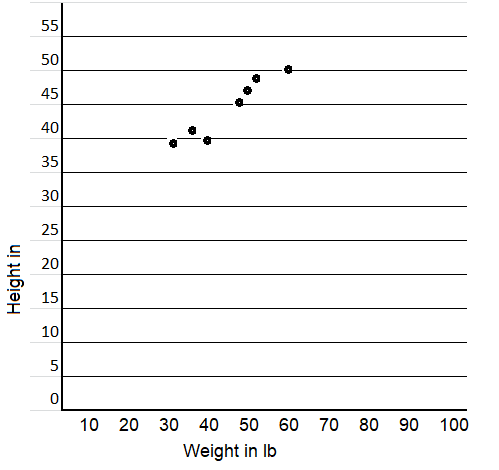
Explanation:
Step 1: Set up the x-axis of a graph with intervals for one set of the data and the y-axis for the other set.
Point Height on x-axis and Weight on the y-axis as shown in the above chart.
Step 2: Use the data sets as ordered pairs to create points on the scatter plot.
All the points are marked on the plot.
Use the data sets below to create scatter plots.
Question 1.
a.

Answer:
Explanation:
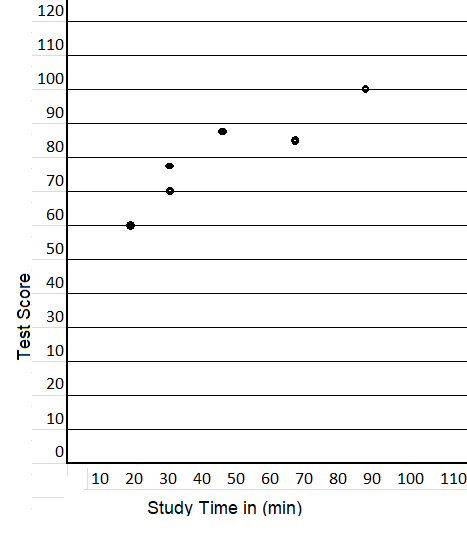
Step 1: Set up the x-axis of a graph with intervals for one set of the data and the y-axis for the other set.
Point Height on x-axis and Weight on the y-axis as shown in the above chart.
Step 2: Use the data sets as ordered pairs to create points on the scatter plot.
All the points are marked on the plot.
b.

Answer:
Explanation:
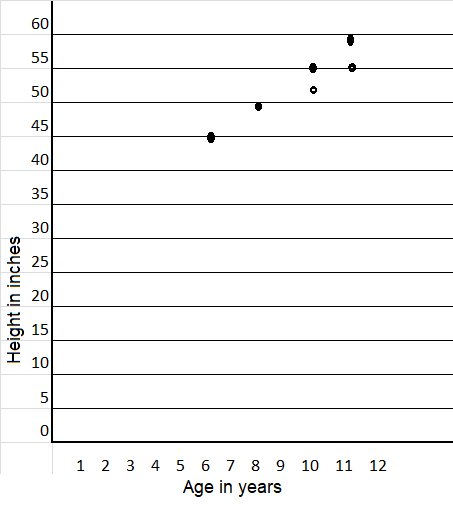
Step 1: Set up the x-axis of a graph with intervals for one set of the data and the y-axis for the other set.
Point Ages in years on x-axis and Heights in inches on the y-axis as shown in the above chart.
Step 2: Use the data sets as ordered pairs to create points on the scatter plot.
All the points are marked on the plot.
Question 2.
a.

Answer:
Explanation:
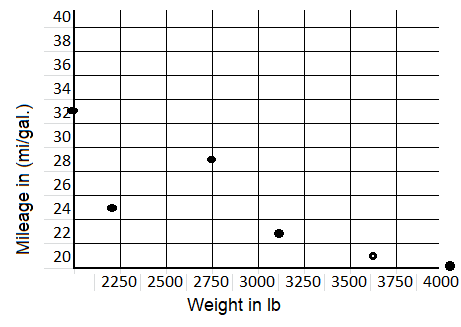
Step 1: Set up the x-axis of a graph with intervals for one set of the data and the y-axis for the other set.
Point Weight on x-axis and Milage on the y-axis as shown in the above chart.
Step 2: Use the data sets as ordered pairs to create points on the scatter plot.
All the points are marked on the plot.
b.

Answer:

Explanation:
Step 1: Set up the x-axis of a graph with intervals for one set of the data and the y-axis for the other set.
Point Hours worked on x-axis and Sales in inches on the y-axis as shown in the above chart.
Step 2: Use the data sets as ordered pairs to create points on the scatter plot.
All the points are marked on the plot.
Question 3.
a.

Answer:
Explanation:
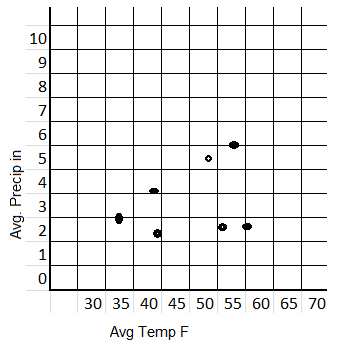
Step 1: Set up the x-axis of a graph with intervals for one set of the data and the y-axis for the other set.
Point Average Temperature F on x-axis and Average Precip in. on the y-axis as shown above.
Step 2: Use the data sets as ordered pairs to create points on the scatter plot.
All the points are marked on the plot.
b.

Answer:
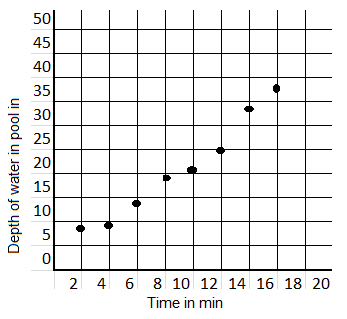
Explanation:
Step 1: Set up the x-axis of a graph with intervals for one set of the data and the y-axis for the other set.
Point Time on x-axis and depth of water in the pool on the y-axis as shown in the above chart.
Step 2: Use the data sets as ordered pairs to create points on the scatter plot.
All the points are marked on the plot.