Students can use the Spectrum Math Grade 8 Answer Key Chapter 4 Pretest as a quick guide to resolve any of their doubts.
Spectrum Math Grade 8 Chapter 4 Pretest Answers Key
Check What You Know
Functions
Decide if each table represents a function by stating yes or no.
Question 1.
a.

______
Answer:
No,
Explanation:
This table does not represent a function because one of the input variables has more than one output variable.
In out put two variables are there for single input.
b.

______
Answer:
Yes,
Explanation:
A function is a relationship between two variables which results in only one output value for each input value.
output = input + b
-4 = 6 + b
-3 = 2 + b
1 = 0 + b
7 = 2 + b
c.

______
Answer:
Yes,
Explanation:
A function is a relationship between two variables which results in only one output value for each input value.
-3 = 4 + b
-2 = 5 + b
0 = 0 + b
4 = 8 + b
Complete each function table for the given function.
Question 2.
a. y = 18x – 4

Answer:
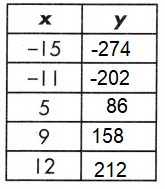
Explanation:
A function is a relationship between two variables which results in only one output value for each input value.
y = 18x – 4
out put = input – 4
y = 18(-15) – 4 = -270 – 4 = -274
y = 18(-11) – 4 = -198 – 4 = -202
y = 18(5) – 4 = 90 – 4 = 86
y = 18(9) – 4 = 162 – 4 = 158
y = 18(12) – 4 = 216 – 4 = 212
b. y = x – 19

Answer:
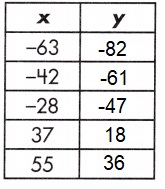
Explanation:
A function is a relationship between two variables which results in only one output value for each input value.
y = x – 19
out put = input – 19
y = -63 – 19 = -82
y = -42 – 19 = – 61
y = -28 – 19 = -47
y = 37 – 19 = 18
y = 55 – 19 = 36
c. y = 12x + 3

Answer:
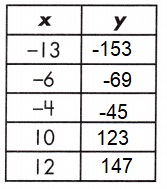
Explanation:
A function is a relationship between two variables which results in only one output value for each input value.
y = 12x + 3
out put = input + 3
y = 12(-13) + 3 = -156 + 3 = -153
y = 12(-6) + 3 = -72 + 3 = -69
y = 12(-4) + 3 = -48 + 3 = -45
y = 12(10) + 3 = 120 + 3 = 123
y = 12(12) + 3 = 144 + 3 = 147
Find the relationship for each function table and then complete the table.
Question 3.
a.

Function: _____
Answer:
31, 85, y = 9x + 4
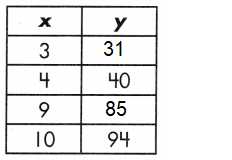
Explanation:
The table of values represents a function.
A linear relationship is in the form of y = mx + b exists.
y = mx + b
Step 1: Find the rate of change by calculating the slope, or rate of change, between the two variables.
\(\frac{y_{2}-y_{1}}{x_{2}-x_{1}}\)
m = \(\frac{94-40}{10-4}\) = \(\frac{54}{6}\) = 9
Step 2: Substitute known values of x and y with the slope into the formula y = mx + b.
y = mx + b
94 = 9 x 10 + b
94 – 90 = b
b = 4
Step 3: Use the found values in the linear function to complete the table.
y = mx + b.
y = 9 (3) + 4
for x = 3 :: y = 31
y = mx + b.
y = 9 (9) + 4
for x = 9 :: y = 85
So, the relationship of the function table is y = 9x + 4
The value of y = 31, 85
b.

Function: _____
Answer:
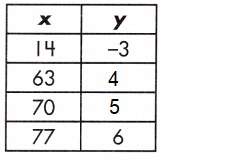
4, 5, y = \(\frac{1}{7}\)x – 5
Explanation:
The table of values represents a function.
A linear relationship is in the form of y = mx + b exists.
y = mx + b
Step 1: Find the rate of change by calculating the slope, or rate of change, between the two variables.
\(\frac{y_{2}-y_{1}}{x_{2}-x_{1}}\)
m = \(\frac{6-(-3)}{77-14}\) = \(\frac{9}{63}\) = \(\frac{1}{7}\)
Step 2: Substitute known values of x and y with the slope into the formula y = mx + b.
y = mx + b
-3 = \(\frac{1}{7}\) x 14 + b
-3 -2 = b
b = -5
Step 3: Use the found values in the linear function to complete the table.
y = mx + b.
y = \(\frac{1}{7}\) (63) – 5
y = 9 – 5 = 4
for x = 63 :: y = 4
y = mx + b.
y = \(\frac{1}{7}\) (70) – 5
y = 10 – 5 = 5
for x = 70 :: y = 5
So, the relationship of the function table is y = 9x + 4
The value of y = 4, 5
Find the rate of change, or slope, for points on the function table and decide if it represents a linear or nonlinear relationship.
Question 4.
a.

Relationship:
___________
Answer:
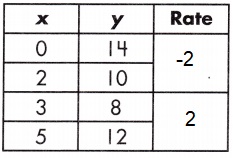
Nonlinear.
Explanation:
The rate of change in a function table by using the slope formula,
\(\frac{y_{2}-y_{1}}{x_{2}-x_{1}}\), across multiple points on the table.
Slope (m) = \(\frac{y_{2}-y_{1}}{x_{2}-x_{1}}\)
Rate = \(\frac{y_{2}-y_{1}}{x_{2}-x_{1}}\)
Rate = \(\frac{10-14}{2 – 0}\)
Rate = \(\frac{-4}{2}\)
Rate = -2
Rate = \(\frac{y_{2}-y_{1}}{x_{2}-x_{1}}\)
Rate = \(\frac{12-8}{5 – 3}\)
Rate = \(\frac{4}{2}\)
Rate = 2
b.

Relationship:
___________
Answer:
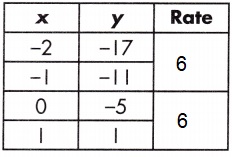
Linear.
Explanation:
The rate of change in a function table by using the slope formula,
\(\frac{y_{2}-y_{1}}{x_{2}-x_{1}}\), across multiple points on the table.
Slope (m) = \(\frac{y_{2}-y_{1}}{x_{2}-x_{1}}\)
Rate = \(\frac{y_{2}-y_{1}}{x_{2}-x_{1}}\)
Rate = \(\frac{-11-(-17)}{-1 – (-2)}\)
Rate = \(\frac{6}{1}\)
Rate = \(\frac{y_{2}-y_{1}}{x_{2}-x_{1}}\)
Rate = \(\frac{1-(-5)}{1 – 0}\)
Rate = \(\frac{6}{1}\)
Rate = 6
Find the rate of change for each function table. Write fractions in simplest form.
Question 5.
a.

rate of change:
___________
Answer:
1
Explanation:
The rate of change that exists in a function can be calculated by finding the ratio of the amount of change in the output variable to the amount of change in the input variable.
![]()
\(\frac{17 – 8}{12 – 3}\)
= \(\frac{9}{9}\) = 1
b.

rate of change:
___________
Answer:
\(\frac{1}{9}\)
Explanation:
The rate of change that exists in a function can be calculated by finding the ratio of the amount of change in the output variable to the amount of change in the input variable.
![]()
\(\frac{10 – 3}{90 – 27}\)
= \(\frac{7}{63}\)
= \(\frac{1}{9}\)
c.

rate of change:
___________
Answer:
\(\frac{5}{4}\)
Explanation:
The rate of change that exists in a function can be calculated by finding the ratio of the amount of change in the output variable to the amount of change in the input variable.
![]()
\(\frac{12 – 2}{14 – 6}\)
= \(\frac{10}{8}\)
= \(\frac{5}{4}\)
Find the initial value of each function represented below.
Question 6.
a.

b = ____
Answer:
-1
Explanation:
The initial value of a linear function is to solve the equation for when the input, or x, equals 0. Use the formula y = mx + b,
where m represents the rate of change and b represents the initial value of the linear.
m = \(\frac{19 – 3}{10 – 2}\)
= \(\frac{16}{8}\)
= 2
y = mx + b,
for x = 2, y = 3 the initial value b is,
3 = 2(2) + b
3 – 4 = b
b = -1
b.

b = ____
Answer:
2
Explanation:
The initial value of a linear function is to solve the equation for when the input, or x, equals 0. Use the formula y = mx + b,
where m represents the rate of change and b represents the initial value of the linear.
m = \(\frac{18 – 2}{4 – 0}\)
= \(\frac{16}{4}\)
= 4
y = mx + b,
for x = 0, y = 2 the initial value b is,
2 = 4(0) + b
b = 2
c.

b = ____
Answer:
3
Explanation:
The initial value of a linear function is to solve the equation for when the input, or x, equals 0. Use the formula y = mx + b,
where m represents the rate of change and b represents the initial value of the linear.
m = \(\frac{11 – 3}{4 – 0}\)
= \(\frac{8}{4}\)
= 2
y = mx + b,
for x = 0, y = 3 the initial value b is,
3 = 2(0) + b
b = 3
Use the information given to find the function models for the linear functions shown.
Question 7.
a. (4, 2) and (8, 5)
y = _____
Answer:
y = \(\frac{3}{4}\)x – 1
Explanation:
m = \(\frac{5 – 2}{8 – 4}\)
m = \(\frac{3}{4}\)
for a point (4, 2) initial value
y = mx + b
2 = \(\frac{3}{4}\)4 + b
b = 2 – 3
b = -1
y = \(\frac{3}{4}\)x – 1
b.

y = _____
Answer:
y = \(\frac{1}{6}\)x
Explanation:
To find the rate of change by calculating the slope, or rate of change, between the two variables.
\(\frac{y_{2}-y_{1}}{x_{2}-x_{1}}\)
\(\frac{5-1}{30-6}\) = \(\frac{4}{24}\)
y = = \(\frac{1}{6}\)
c.

y = _____
Answer:
y = \(\frac{1}{3}\)x + 4
Explanation:
for x= 0 initial value b
y = 4 as per the graph.
b = 4
Mark the point where the line will cross the y-axis (b = 4).
Draw a line that goes directly through the points found.
(-3, 3) and (3, 5)
m = \(\frac{5-1}{3-(3)}\)
m = \(\frac{4}{6}\)
m = \(\frac{2}{3}\)
y = \(\frac{1}{3}\)x + 4
Compare the rate of change for the equation and table and decide which has a greater rate of change by writing equation or table.
Question 8.
y = 6x – 2 or
 ____________
Answer:
Equation.
Explanation:
Rate of change for table = \(\frac{-13-5}{6-(-3)}\) = \(\frac{18}{9}\) = 2
Rate of change for equation,
y = 6x – 2
Rate of change is judged by larger absolute value, therefore, the rate of change for the function represented in the equation is larger than the rate of change shown by the table.