This handy Spectrum Math Grade 7 Answer Key Chapter 7 Lesson 7.2 Frequency Tables provides detailed answers for the workbook questions
Spectrum Math Grade 7 Chapter 7 Lesson 7.2 Frequency Tables Answers Key
A frequency table shows how often an item, a number, or a range of numbers occurs. The cumulative frequency is the sum of all frequencies up to and including the current one. The relative frequency is the percentage of a specific frequency.
Make a frequency table for these test scores:
71, 85, 73, 92, 86, 79, 87,
98, 82, 93, 81, 89, 88, 96.
Answer:
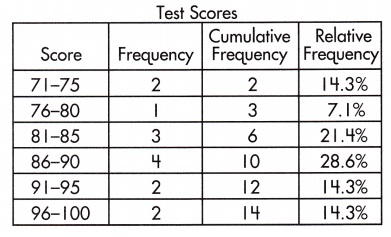
Explanation:
Given from the test scores calculated the frequency, cumulative frequency and relative frequency .
Use the following data to complete the frequency table.
Question 1.
Cats’ weights (in pounds):
9.4375, 11.375, 12.1875, 11.625, 8.625, 9.6875, 8.875, 12.5, 9.375, 10.25, 10.625, 12.0625, 11.875, 8.9375, 9.75, 10.1875, 10.125, 10.1875, 12.0, 9.125
Answer:
Explanation:
Given from the frequency table of cat’s weight calculated the frequency, cumulative frequency and relative frequency.
Answer the following questions about the frequency table above.
Question 2.
How many cats weigh 12-12.5 pounds?
Answer:
4,
Explanation:
Given from the frequency table the cat’s weigh 12-12.5 is 4.
Question 3.
How many cats weigh 10.6-10.99 pounds?
Answer:
1,
Explanation:
Given from the frequency table the cat’s weigh 10.6-10.99 is 1.
Question 4.
How many cats weigh less than 10 pounds?
Answer:
8,
Explanation:
Given from the frequency table the cat’s weigh less than 10 pounds is 8.
Question 5.
How many cats weigh 11 pounds or more?
Answer:
7,
Explanation:
Given from the frequency table the cat’s weigh about 11 pounds or more is 7.
Question 6.
What percentage of cats are 10-10.5 pounds?
Answer:
20%,
Explanation:
Given from the frequency table the percentage of cat’s of 10-10.5 pounds is 20%.
Question 7.
What percentage of cats are less than 9 pounds?
Answer:
15%,
Explanation:
Given from the frequency table percentage of cats are less than 9 pounds is 15%.
A frequency table can be created by looking at a data set, choosing ranges for examining the data, and calculating the frequency with which the data occurs in the set.
14, 15, 12, 15, 12, 13, 20, 15, 21, 25, 16, 18, 17, 21, 23, 16, 23, 19, 23, 22
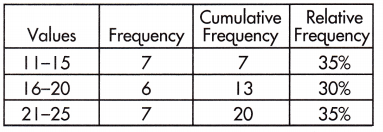
Step 1: Choose the value ranges for the table
Step 2: Find the frequency for each value range.
Step 3: Calculate the cumulative frequency by finding the sum of all frequencies up to and including the current one.
Step 4: Find the relative frequency by calculating the percentage of the whole that is made up by each frequency.
Create a frequency table for each data set.
Question 1.
6, 6, 5, 4, 6, 6, 8, 6, 3, 2, 4, 5, 6, 8, 8, 3, 3, 3, 4, 3
Answer:
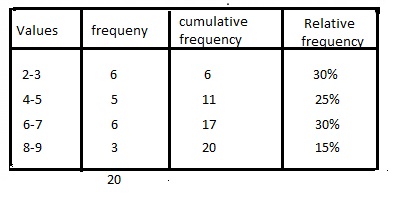
Explanation:
Given from the frequency data set calculated the frequency ,cumulative frequency and relative frequency respectively.
Question 2.
24, 22, 26, 24, 25, 22, 21, 21
Answer:
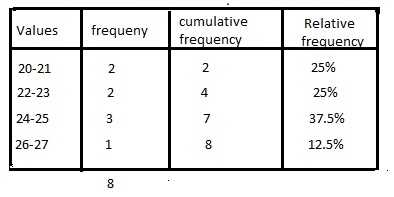
Explanation:
Given from the frequency data set calculated the frequency, cumulative frequency and relative frequency respectively.
Question 3.
8, 6, 8, 7, 7, 5, 8, 5, 5, 6, 8, 4, 2
Answer:
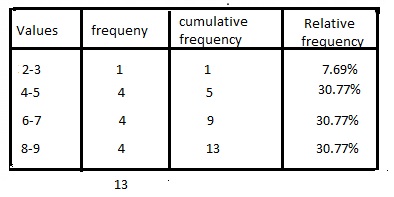
Explanation:
Given from the frequency data set calculated the frequency , cumulative frequency and Relative frequency respectively.