This handy Spectrum Math Grade 7 Answer Key Chapter 6 Posttest provides detailed answers for the workbook questions
Spectrum Math Grade 7 Chapter 6 Posttest Answers Key
Check What You Learned
Use the following data set to complete the problems.
![]()
Question 1.
Make a stem-and-leaf plot to represent the data.
Answer:
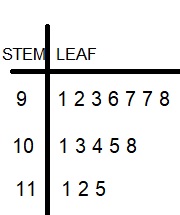
Explanation:
A stem and leaf plot is used to organize data as they are collected.
Stem and leaf plots display the shape and spread of a continuous data distribution.
These graphs are similar to histograms, but instead of using bars, they show digits.
Each number in the data is broken down into a stem and a leaf, thus the name.
The stem of the number includes all but the last digit.
The leaf of the number will always be a single digit.
Question 2.
Find the mean, median, mode, and range of the data.
mean: _____________
mode: _____________
median: _____________
range: _____________
Answer:
mean: 101.5
mode: 101
median: 97
range: 24
Explanation:
Given set of data is: 93, 105, 92, 111, 98, 97, 108, 101, 112, 115, 96, 104, 103, 91, 97
We know that,
The mean is the average of a set of numbers.
It is found by adding the set of numbers and then dividing by the number of addends.
93 + 105 + 92 + 111 + 98 + 97 + 108 + 101 + 112 + 115 + 96 + 104 + 103 + 91 + 97 = \(\frac{1523}{15}\) = 101.5
We know that,
The median is the middle number of a set of numbers that is ordered from least to greatest.
When there is an odd amount of numbers, the middle number is the median.
Arrange the numbers from least to greatest to find median.
91, 92, 93, 96, 97, 97, 98, 101, 103, 104, 105, 108, 111, 112, 115 = 101
We know that,
The mode is the number that appears most often in a set of numbers.
Arrange the numbers from least to greatest to find mode.
91, 92, 93, 96, 97, 97, 98, 101, 103, 104, 105, 108, 111, 112, 115 = 97
We know that,
The range is the difference between the greatest and least numbers in the set.
Arrange the numbers from least to greatest to find range.
91, 92, 93, 96, 97, 97, 98, 101, 103, 104, 105, 108, 111, 112, 115 = 115 – 91 = 24
Question 3.
How many days did over 100 cars cross the bridge?
Answer:
8
Explanation:
Given set of data of cars across the bridge per day are as follows:
93, 105, 92, 111, 98, 97, 108, 101, 112, 115, 96, 104, 103, 91, 97
Arrange the numbers from least to greatest to find range.
91, 92, 93, 96, 97, 97, 98, 101, 103, 104, 105, 108, 111, 112, 115
When we observe the data on 8 days 100 cars cross the bride.
Question 4.
If the sample represents a 75-day time period, what is the most likely number of days that over 100 cars crossed the bridge in that time?
Answer:
40
Explanation:
Given that,
cars cross the bridge per day and 15 samples for 15 days.
for 75 days 75 samples can collect
15 samples 8 days, over 100 cars crossed the bridge in that time
75 samples x days, over 100 cars crossed the bridge in that time
by cross multiplying to find the unknown cars crossed the bridge in that time over 75 days samples are shown below: \(\frac{8 × 75}{15}\) = 40
Question 5.
How many days did between 90 and 95 cars cross the bridge?
Answer:
3
Explanation:
Given set of data of cars across the bridge per day are as follows:
93, 105, 92, 111, 98, 97, 108, 101, 112, 115, 96, 104, 103, 91, 97
Arrange the numbers from least to greatest to find range.
91, 92, 93, 96, 97, 97, 98, 101, 103, 104, 105, 108, 111, 112, 115
When we observe the data on 3 days about 90 to 95 cars cross the bride.
Question 6.
What percentage of the sample represents between 90 and 95 cars crossing the bridge?
Answer:
20%
Explanation:
Given set of data of cars across the bridge per day are as follows:
93, 105, 92, 111, 98, 97, 108, 101, 112, 115, 96, 104, 103, 91, 97
Arrange the numbers from least to greatest to find range.
91, 92, 93, 96, 97, 97, 98, 101, 103, 104, 105, 108, 111, 112, 115
When we observe the data on 8th day 100 cars cross the bride.
The percentage of the sample represents between 90 and 95 cars crossing the bridge,
\(\frac{3}{15}\) x 100 = \(\frac{300}{15}\) = 20%
Tell if each sample would be considered random or biased.
Question 7.
Lonnie wants to know where most people like to go on vacation.
He surveyed 20 people at a mountain town in Colorado. ______________
Answer:
biased sample.
Explanation:
A sampling method is called biased if it systematically favors some outcomes over others.
Lonnie wants to know where most people like to go on vacation.
He surveyed 20 people at a mountain town in Colorado is biased sampling.
Question 8.
Antonio wants to know what is the most popular type of book to read.
He surveyed 100 people coming out of a bookstore over a 3-day weekend. ______________
Answer:
random sample.
Explanation:
A sample in which every person, object, or event has an equal chance of being selected is called a random sample. A random sample is more likely to be representative of the entire population than other types of samples.
Antonio wants to know what is the most popular type of book to read.
He surveyed 100 people coming out of a bookstore over a 3-day weekend is random sampling.
Use the data sets below to answer the questions.
Seven dogs and seven rabbits run around a track. Their times are listed below.

Question 9.
Draw histograms to represent both sets of data.
Answer:
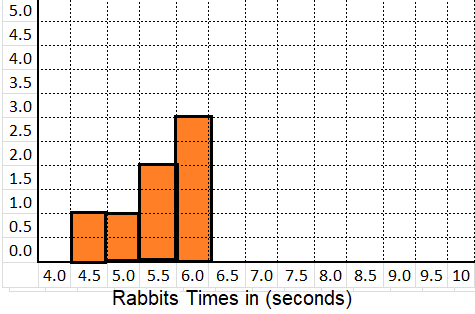
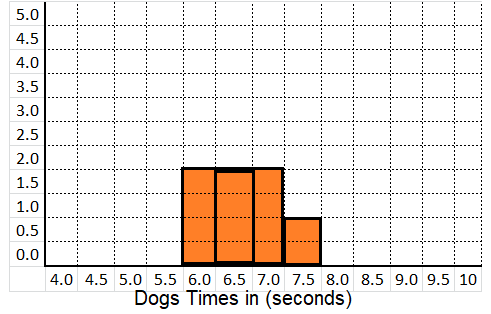
Explanation:
We know that,
A histogram is a graphical representation of discrete or continuous data.
The area of a bar in a histogram is equal to the frequency.
The y -axis is plotted by frequency density and the x -axis is plotted with the range of values divided into intervals.
So, Seven dogs and seven rabbits run around a track and their times are shown in the above histogram.
Question 10.
Find the measures of center and range for both sets of data.
a. mean: ______________________
median: ______________________
mode: ________________________
range: ______________________
Answer:
mean: 6.8
median: 6.6
mode: none
range: 1.2
Explanation:
Given set of data is: 6.3, 7.2, 6.5, 7.5, 7.1, 6.6, 6.4
We know that,
The mean is the average of a set of numbers.
It is found by adding the set of numbers and then dividing by the number of addends.
6.3 + 7.2 + 6.5 + 7.5 + 7.1 + 6.6 + 6.4 = \(\frac{47.6}{7}\) = 6.8
We know that,
The median is the middle number of a set of numbers that is ordered from least to greatest.
When there is a odd amount of numbers, the middle number is the median.
Arrange the numbers from least to greatest to find median.
6.3, 6.4, 6.5, 6.6, 7.1, 7.2, 7.5 = 6.6
We know that,
The mode is the number that appears most often in a set of numbers.
Arrange the numbers from least to greatest to find mode.
6.3, 6.4, 6.5, 6.6, 7.1, 7.2, 7.5
We observe that none of the number is repeated.
We know that,
The range is the difference between the greatest and least numbers in the set.
Arrange the numbers from least to greatest to find range.
6.3, 6.4, 6.5, 6.6, 7.1, 7.2, 7.5 = 7.5 – 6.3 = 1.2
b. mean: ______________________
median: ______________________
mode: ________________________
range: ______________________
Answer:
mean: 5.7
median: 5.6
mode: 5.6 and 6.2
range: 1.3
Explanation:
Given set of data is: 5.4, 6.0, 5.6, 6.2, 4.9, 5.6, 6.2
We know that,
The mean is the average of a set of numbers.
It is found by adding the set of numbers and then dividing by the number of addends.
5.4 + 6.0 + 5.6 + 6.2 + 4.9 + 5.6 + 6.2 = \(\frac{39.9}{7}\) = 5.7
We know that,
The median is the middle number of a set of numbers that is ordered from least to greatest.
When there is a odd amount of numbers, the middle number is the median.
Arrange the numbers from least to greatest to find median.
4.9, 5.4, 5.6, 5.6, 6.0, 6.2, 6.2 = 5.6
We know that,
The mode is the number that appears most often in a set of numbers.
Arrange the numbers from least to greatest to find mode.
4.9, 5.4, 5.6, 5.6, 6.0, 6.2, 6.2 = 5.6 and 6.2
We know that,
The range is the difference between the greatest and least numbers in the set.
Arrange the numbers from least to greatest to find range.
4.9, 5.4, 5.6, 5.6, 6.0, 6.2, 6.2 = 6.2 – 4.9 = 1.3
Question 11.
How are the two data sets alike and different?
alike: ___________________________
different: __________________________
Answer:
alike: range.
different: mean speed of dog is higher than the mean speed of rabbits.
Explanation:
From the above given information,
the range of the two data sets are alike.
Range of dog is 1.2.
round to the nearest tenth as 1.
Range of rabbit is 1.3.
round to the nearest tenth as 1.
So, the range of two data sets are alike.
Similarly, mean speed of dog is higher than the mean speed of rabbits.
Mean speed of dog is 6.8.
Mean speed of rabbit is 5.7.
Question 12.
Based on this data, what is the difference between these two animals?
Answer:
Rabbits are not faster than dogs.
Explanation:
From the above given information,
we observe the difference between these two animals time and speed run around a track,
states concludes that rabbits are not faster than dogs.
Tell if each is an example of a sample or a population.
Question 13.
a. every 7th person’s bag is checked at the airport.
Answer:
sample.
Explanation:
A sample is the specific group that collect data from.
The size of the sample is always less than the total size of the population.
So, the above statement every 7th person’s bag is checked at the airport is a sample.
b. all children under the age of 2.
Answer:
population.
Explanation:
A population is the entire group that you want to draw conclusions about.
So, the above statement all children under the age of 2 is a population.