Students can use the Spectrum Math Grade 3 Answer Key Chapter 7 Lesson 7.2 Drawing Picture Graphs as a quick guide to resolve any of their doubts.
Spectrum Math Grade 3 Chapter 7 Lesson 7.2 Drawing Picture Graphs Answers Key
A picture graph uses symbols to represent data.
The key tells you the value of each symbol on the picture graph.
Use the frequency table to complete the graph.
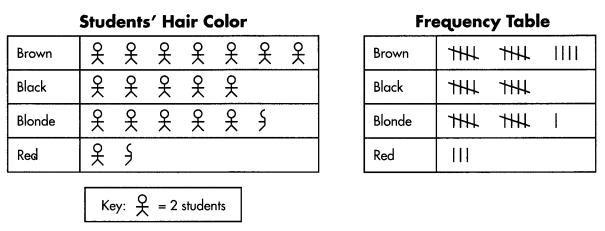
How many students have red hair?
Each stick figure represents two students.
Count by twos when counting the stick figures in the row labeled “red.” Add I to the sum for the half stick figure.
3 students have red hair.
Complete the picture graph. Answer the question.
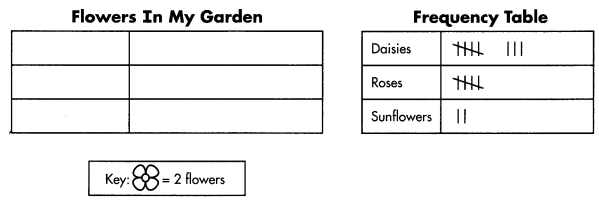
How many total flowers are in the garden?
Answer:
Total flowers in the garden are 15 flowers,
Explanation:
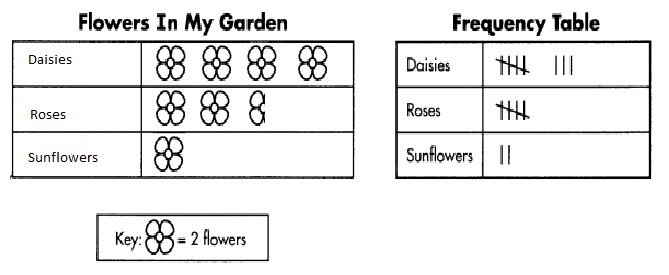
Used the picture graph to find the total flowers in the garden therefore total flowers in the garden are 15 flowers.