Practice with the help of Spectrum Math Grade 1 Answer Key Chapter 5 Lesson 5.8 Collecting Data regularly and improve your accuracy in solving questions.
Spectrum Math Grade 1 Chapter 5 Lesson 5.8 Collecting Data Answers Key
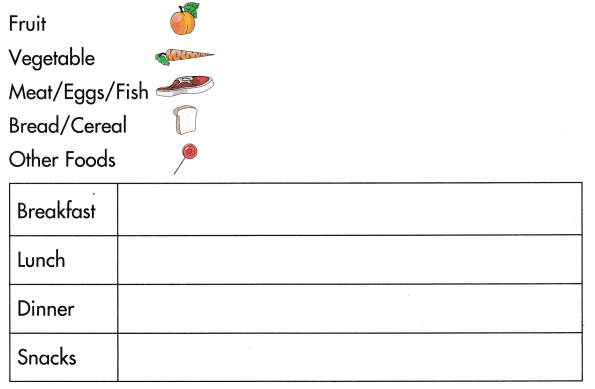
Make a food chart for one day. Show what you ate.
1.
Answer:
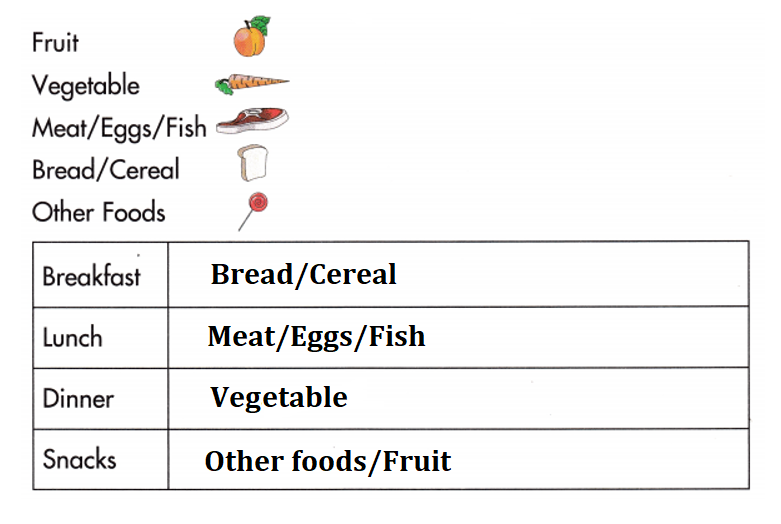
Explanation:
Break Fast – Bread/Cereal.
Lunch – Meat/Eggs/Fish.
Dinner -Vegetables.
Snacks – Other foods/ Fruit.
Use your food chart.
2. How many of each did you eat?
Fruit ________ Bread/Cereal ______
Vegetable _____ Other Foods ______
Meat/Eggs/Fish ______
What food did you eat the most? ________
At which meal did you eat the most? _____
What is your favorite food? _____________
Answer:
=> Food I eat the most:
Fruit – Apples.
Bread/Cereal – bread
Vegetable – All kinds of vegatables.
Other Foods – Chocolates/Biscuits.
Meat/Eggs/Fish – Meat / Eggs.
Meal I eat more is Egg.
My favourite food is Vegetables.
Explanation:
Fruit ________ Bread/Cereal ______
Vegetable _____ Other Foods ______
Meat/Eggs/Fish ______
=> Food I eat the most:
Fruit – Apples.
Bread/Cereal – bread
Vegetable – All kinds of vegatables.
Other Foods – Chocolates/Biscuits.
Meat/Eggs/Fish – Meat / Eggs.
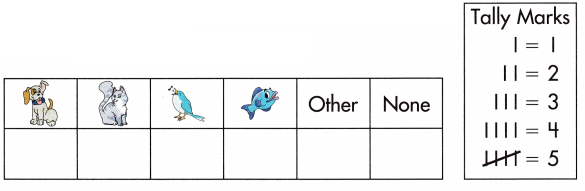
3. Make a pet chart. Ask 20 people if they have a pet. Use tally marks to show what kind.
a. How many people have  _____
_____
Answer:
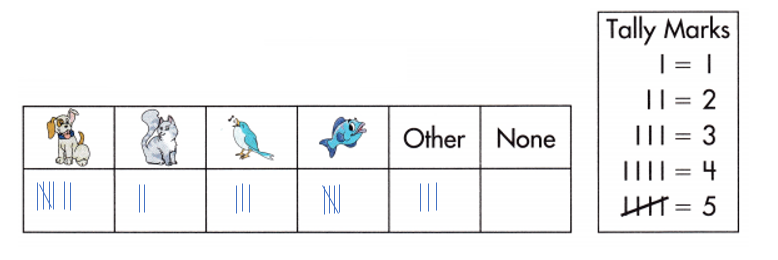
Number of people having dogs as pets are Seven or 7.
Explanation:
Tally marks to show:
Number of people having pets.
b. How many people have ![]() _____
_____
Answer:
Number of people having cats as pets are 2.
Explanation:
Tally marks to show:
Number of people having pets.
Tally marks to show:
Number of people having pets.
c. How many people have ![]() _______
_______
Answer:
Number of people having birds as pets are 3.
Explanation:
Tally marks to show:
Number of people having pets.
d. How many people have ![]() _____
_____
Answer:
Number of people having fishes as pets are Five or 5.
Explanation:
Tally marks to show:
Number of people having pets.
e. How many people do not have a pet? _____
Answer:
Number of people having no pets are Zero or 0.
Explanation:
Tally marks to show:
Number of people having pets.
f. How many people have a pet that is not on the chart? _____
Answer:
Number of people having a pet that is not on the chart (others) are three or three.
Explanation:
Tally marks to show: Number of people having pets.
Complete.
g. Which pet is the favorite? ________
Answer:
Dog is the favourite pet.
Explanation:
Number of people having a dog as pet = 7.
Number of people having a cat as pet = 2.
Number of people having a bird as pet = 3.
Number of people having a fish as pet = 5.
Number of people having a others as pet = 3.
Number of people having a no pet = 0.
h. Which pet is the least favorite? ___________
Answer:
Cat is the least favourite pet.
Explanation:
Number of people having a dog as pet = 7.
Number of people having a cat as pet = 2.
Number of people having a bird as pet = 3.
Number of people having a fish as pet = 5.
Number of people having a others as pet = 3.
Number of people having a no pet = 0.
Make a fruit chart. Ask 20 people if they have a favorite fruit.
4. Use tally marks to show what kind.
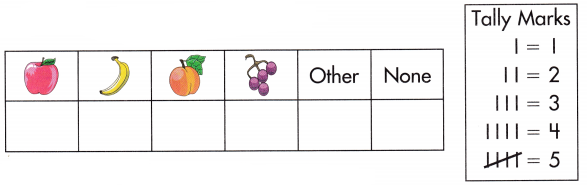
Use your fruit chart. Write the number.
a. How many people like ![]() _____
_____
Answer:
Number of people like apple are 4 or four.
Explanation:
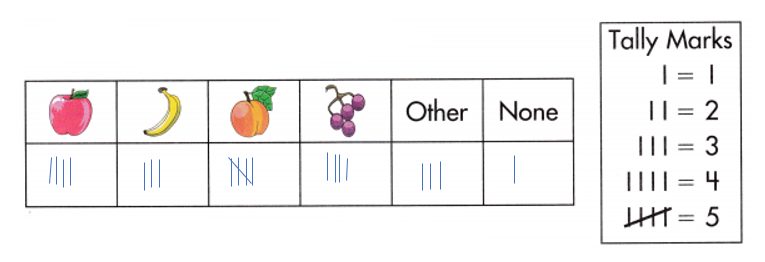
b. How many people like ![]() _____
_____
Answer:
Number of people like banana are 3 or three.
Explanation:
c. How many people like ![]() _____
_____
Answer:
Number of people like orange are 5 or five.
Explanation:
d. How many people like ![]() _____
_____
Answer:
Number of people like grapes are 4 or four.
Explanation:
e. How many people like a fruit that is not on the chart? _____
Answer:
Number of people like a fruit that is not on the chart (other) are 3 or three.
Explanation:
f. How many people do not like fruit? _____
Answer:
Number of people do not like fruit are 1 or one.
Explanation:
Complete.
g. Which is the favorite fruit? _____
Answer:
Orange is the favourite fruit.
Explanation:
Number of people like apple fruit = 4.
Number of people like banana fruit = 3.
Number of people like orange fruit = 5.
Number of people like grapes fruit = 4.
Number of people like other fruits = 3.
Number of people do not like fruit = 1.
h. Which is the least favorite fruit? _____
Answer:
Banana and other fruit is the least favorite fruit.
Explanation:
Number of people like apple fruit = 4.
Number of people like banana fruit = 3.
Number of people like orange fruit = 5.
Number of people like grapes fruit = 4.
Number of people like other fruits = 3.
Number of people do not like fruit = 1.
5. How many more people chose the favorite fruit than chose the least favorite fruit? _____
Answer:
2 more people chose the favorite fruit than chose the least favorite fruit.
Explanation:
Number of people like orange fruit = 5.
Number of people like banana fruit = 3.
Difference:
Number of people like orange fruit – = 3.
= 5 – 3
= 2.