In this article, we learn how to calculate the frequencies of mean observations. The purpose of tabulation data is to represent complicated information or data into order and allows the viewers to represent the data easily and interpret it. The Mean is defined as the ratio of the sum of observations or data sets divided by the total number of data. Let us learn the meaning of mean, Types of data, advantages of mean, mean formula, example problems on mean calculation.
Read More:
What is meant by Mean?
Mean is defined as the sum of observations divided by the total number of observations. From the frequency table, the mean of tabular data is adding all the given data and dividing the sum with a number of data.
Types of Data
We will represent the data either in Raw Form (or) Tabular Form. Let us find both cases of Mean.
- In Raw form, we using the below formula for calculating the Mean. Raw form means ungrouped data. The formulas of ungrouped data (or) raw data is as shown are below,
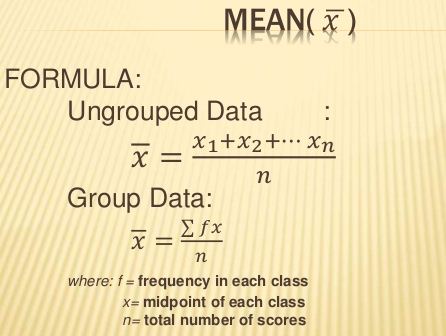
- In Tabular (frequency distribution) form of data can be represented, we can use the below formula for calculating the Mean,
Mean = Sum of Product of Variables and their Corresponding Frequencies/Total Frequency
If the frequencies of n observations, the mean of the tabulated data are considered as x1, x2, x3, ……. xn and frequencies are f1, f2, f3, …… fn then the formula of mean tabulated data is,
Mean = (f1x1 + f2x2 + f3x3 ……… fnxn)/( f1 + f2 + f3 ………. fn) = (∑ fixi)/(∑fi)
Advantages of Mean
- The Mean concept is familiar to most people.
- In the Mean, every data set has one and only one Mean.
- Mean is the best choice when we need a measure the central tendency that should reflect the total of the scores.
- Mean is the most useful measure of central tendency when we need to do further statistical computation.
Data Tabulation of Mean
The data table is executed depends upon the cost, type, and size, availability, time of disposal, and some other factors. In tabulation, the computer converts the data into a numeric form. In the tabulation, one can use the lists, tally, and counting method depends upon the data.
- Lists and Tally Method: In this method, a large number of questions are listed in one place, and then the response of each data is represented in rows, and corresponding to each data is represented in columns.
- Direct Tally Method: In this method, first write code into a tally sheet then the stroke is marked against the codes and note the response. Every four strokes are completed after the fifth response is represented into a horizontal or diagonal line through the stroke.
- Count Method or Card Method: In this method, the data is recorded into various sizes and shapes with the help of series holes. It is the most efficient tabulation method, in these cards belongs to each category is segregated and counted and the frequencies are recorded. These methods will be suitable for 40 items on a single page.
Problems on Mean of Tabulated Data
Problem 1:
Find the mean of the given data. In a class of 20 students, marks obtained by students in English out of 50 are tabulated below.
| Marks obtained | Number of students | Class Marks | fi xi |
|---|---|---|---|
| 10 – 20 | 4 | 15 | 60 |
| 20 – 30 | 6 | 25 | 150 |
| 30 – 40 | 8 | 35 | 280 |
| 40 – 50 | 2 | 50 | 100 |
Solution:
Given the data of 20 students’ marks in English out of 50 marks.
Now, we are finding the mean of the given data.
We know the formula of Mean,
Mean = Sum of Observations/ Total number of Observations.
Total number of observations of the given value is, 4 + 6 + 8 + 2 = 20.
Sum of Observations of given data is, 60 + 150 + 280 + 100 = 590.
Substitute the above values in the Mean formula, we get
The Mean of the given data is 590/ 20 = 29.5
Therefore the Mean of the data is 29.5
Problem 2:
If the mean of the frequency distribution is 4. Find the value of ‘ x ‘ and write the tally marks also.
| Variables (xi) | 4 | 3 | 1 | 2 |
|---|---|---|---|---|
| Frequency (fi) | 10 | 4 | 2 | x |
Solution:
Given the mean value or frequency distribution value is 4.
Now, we draw the frequency distribution table with tally marks is as shown below,
| Variable (xi) | Tally Marks | Frequency (fi) | fi xi |
|---|---|---|---|
| 4 | IIII | 10 | 40 |
| 3 | III | 4 | 12 |
| 1 | I | 2 | 2 |
| 2 | II | x | 2x |
We know the Mean formula,
Mean = sum of observations / The total number of observations
But mean is given the data, Mean is 4.
Sum of Observations is, 40 + 12 + 2 + 4x = 2x + 54
The total number of observations is , 10 + 4 + 2 + x = 16 + x.
Now substitute the above values in the Mean formula, we get
8 = (2x + 54) / (16 + x)
8 (16 + x) = 2x + 54
128+ 8x = 2x + 54
128 – 54 = 8x – 2x
74 = 6x
74 / 6 = 12. 33
Therefore the value of ‘ x ‘ in the given data is 12. 33.
FAQs on Mean of Tabulated Data
1. How do you define Mean?
The mean is defined as the average of the numbers. It is easy to calculate: add up all the numbers, then divide by how many numbers there are. In other words, it is the sum divided by the count.
2. What are the advantages of Mean?
The advantages of Mean are:
- Mean is useful for comparison.
- The Mean concept is familiar to most people.
- In the Mean, every data set has one and only one Mean.
- Mean is the best choice when we need a measure the central tendency that should reflect the total of the scores.
- Mean is the most useful measure of central tendency when we need to do further statistical computation.
3. What is mean and its uses?
The mean is the sum of the values in a data set divided by the total number of values in the data set. It is also known as average. The mean can be used to get an overall idea of the data set, it is best used for a data set with numbers that are close together.
4. What is the difference between Mean and Average?
The average is the sum of all values divided by the number of values. In statistics, the mean is the average of the given sample or data set. It is equal to the total of observations divided by the number of observations.