All the solutions provided in McGraw Hill My Math Grade 4 Answer Key PDF Chapter 11 Lesson 8 Display Measurement Data in a Line Plot will give you a clear idea of the concepts.
McGraw-Hill My Math Grade 4 Answer Key Chapter 11 Lesson 8 Display Measurement Data in a Line Plot
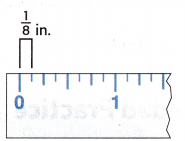
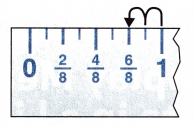
You can represent measurement data for fractions of a unit in a line plot. The line plot’s number line will look like a ruler.
Math in My World
Example 1
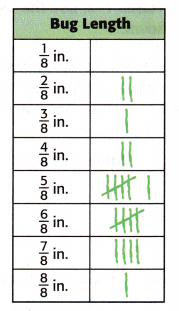
The Science room has a collection of bugs. Each bug’s length is measured to the nearest eighth of an inch. Make a line plot to represent the data.
The measurement data are shown in the tally chart.
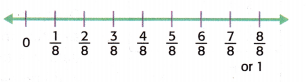
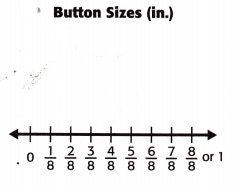
1. First, make a number line to represent the value of each bug’s length.
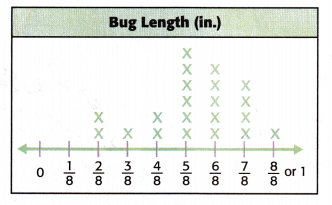
2. Next, place an X above each measurement every time that value occurred.
Example 2
Refer to Example 1. Find the difference in length between the longest and shortest bug.
To find the difference between the longest and shortest bugs, subtract the shortest length from the longest length.
Subtract like fractions.
\(\frac{8}{8}\) – \(\frac{2}{8}\)
= \(\frac{8-2}{8}\) = \(\frac{6}{8}\)
= \(\frac{3}{4}\)
So, the difference between the longest and the shortest bugs in the collection is ____________ of an inch.
Answer:
So, the difference between the longest and the shortest bugs in the collection is \(\frac{3}{4}\) of an inch.
Talk Math
Describe a real-world situation in which the data in a tally chart and line plot could be helpful.
Answer:
A real-world situation in which the data in a tally chart and line plot could be helpful is the count of students in a school or marks of students in a class.
The count of students in a school can be helpful in knowing the strength of each student in the school.
The marks of students in a class can be helpful to know the highest and lowest scored marks of the students.
Guided Practice
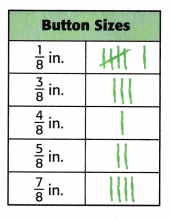
For Exercises 1-2, use the tally chart shown.
Question 1.
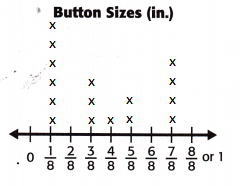
The tally chart represents the widths of buttons collected by Bella’s mother. Represent this data in a line plot.
Answer:
To draw a line plot, place an X above each measurement every time that value occurred.
Question 2.
Suppose the buttons that were \(\frac{3}{8}\)-inch wide were laid in a row touching. How far would that row extend?
Answer:
If the buttons \(\frac{3}{8}\)-inch wide were laid in a row touching, it would extend till \(\frac{3}{8}\) + \(\frac{3}{8}\) + \(\frac{3}{8}\) = \(\frac{9}{8}\)
Independent Practice
For Exercises 3-6, use the table shown.
Question 3.
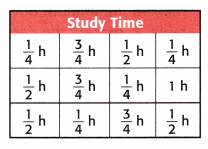
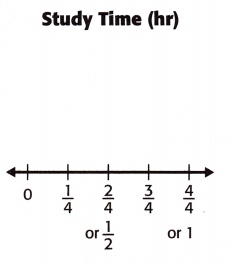
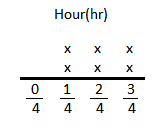
Mathematical PRACTICE Model Math The frequency table represents fractions of an hour Sonja studied each evening over the last 2 weeks. Represent this data in a line plot.
Answer:
To draw a line plot, place an X above each measurement every time that value occurred.

Question 4.
Which time interval was least frequent as a study time for Sonja? Explain.
Answer:
As there is only 1 least point marked on the \(\frac{4}{4}\) hr. So,1 hr is the least frequent study time for Sonja.
Question 5.
What is the difference in the total time spent studying during the \(\frac{3}{4}\)-hour time intervals and the \(\frac{1}{2}\)-hour intervals?
Answer:
Time spent in studying duirng \(\frac{3}{4}\)-hour time intervals is 3× \(\frac{3}{4}\) = \(\frac{9}{4}\) hr
Time spent in studying duirng \(\frac{1}{2}\)-hour intervals is 4 × \(\frac{1}{2}\) = \(\frac{4}{2}\) or \(\frac{8}{4}\) hr
The difference in the total time spent studying during the \(\frac{3}{4}\)-hour time intervals and the \(\frac{1}{2}\)-hour intervals will be \(\frac{9}{4}\) – \(\frac{8}{4}\) = \(\frac{1}{4}\) hr
Question 6.
What is the total time Sonja spent studying over the last two weeks in minutes? What is the equivalent time in hours and minutes?
Answer:
Time spent in studying duirng \(\frac{1}{4}\)-hour time intervals is 4× \(\frac{1}{4}\) = \(\frac{4}{4}\) hr
Time spent in studying duirng \(\frac{2}{4}\)-hour intervals is 4 × \(\frac{1}{2}\) = \(\frac{4}{2}\) or \(\frac{8}{4}\) hr
Time spent in studying duirng \(\frac{3}{4}\)-hour time intervals is 3× \(\frac{3}{4}\) = \(\frac{9}{4}\) hr
Time spent in studying duirng \(\frac{4}{4}\)-hour intervals is 1 × \(\frac{4}{4}\) = \(\frac{4}{4}\) hr
Total time in hrs will be
\(\frac{4}{4}\) + \(\frac{8}{4}\) + \(\frac{9}{4}\) + \(\frac{4}{4}\) = \(\frac{25}{4}\) hr or 6 \(\frac{1}{4}\) hr.
\(\frac{1}{4}\) of a hour will be 15 mins.
Therefore, the equivalent time in hours and minutes will be 6 hrs and 15 mins.
Problem Solving
For Exercises 7-10, use the table shown.
Question 7.
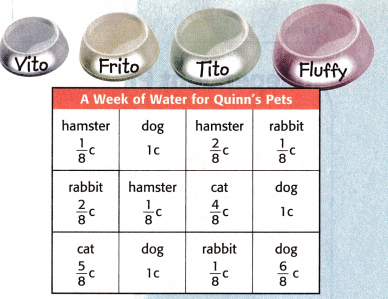
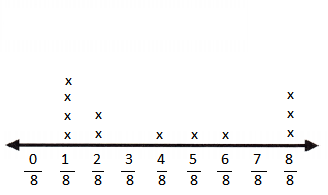
Every time one of Quinn’s pets needed its water refilled over the past week, he marked the amount of water given in a table. Represent the data in a line plot.

Answer:
To draw a line plot, place an X above each measurement every time that value occurred.
Question 8.
What is the difference between the smallest amount of water and the greatest amount of water Quinn gave to his pets over the week? Explain.
Answer:
The smallest amount of water is \(\frac{1}{8}\) c.
The largest amount of water is \(\frac{8}{8}\) c.
The difference between the smallest amount of water and the greatest amount of water Quinn gave to his pets over the week will be \(\frac{8}{8}\) – \(\frac{1}{8}\) = \(\frac{7}{8}\)c
Question 9.
Mathematical PRACTICE Draw a Conclusion How much more water did the cat get than the hamster over the course of the week? Explain.
Answer:
The total amount of water the cat got \(\frac{4}{8}\) + \(\frac{5}{8}\) = \(\frac{9}{8}\)
The total amount of water the hamster got 2×\(\frac{1}{8}\) + \(\frac{2}{8}\) = \(\frac{4}{8}\)
The cat got \(\frac{9}{8}\) – \(\frac{4}{8}\) = \(\frac{5}{8}\)c more than hamster over the course of the week.
HOT Problems
Question 10.
Mathematical PRACTICE Explain t0 a Friend Explain to a friend the similarity between the number lines on a line plot and the markings on a ruler.
Answer:
The similarity between the number lines on a line plot and the markings on a ruler is that both the lines displays the whole number and fractions.
Question 11.
Building on the Essential Question Line plots can be used to display measurement data. Name another way to display measurement data.
Answer:
Line graph will be the another way to display measurement data.
Line garphs is formed by connecting the individual data points.
McGraw Hill My Math Grade 4 Chapter 11 Lesson 8 My Homework Answer Key
Practice
Question 1.
Refer to the Homework Helper. What is the difference between the greatest green bean weight and the least green bean weight?
Answer:
The length of greatest green bean weight is 1 pound and the length of the least green bean weight is \(\frac{1}{4}\) pound.
The difference between the greatest green bean weight and the least green bean weight will be 1 – \(\frac{1}{4}\) = \(\frac{4}{4}\) – \(\frac{1}{4}\) = \(\frac{3}{4}\) pounds.
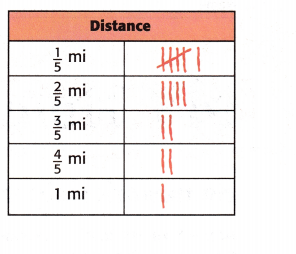
For Exercises 2 and 3, use the tally chart shown. The tally chart represents the distance some children were able to ride on a unicycle.
Question 2.
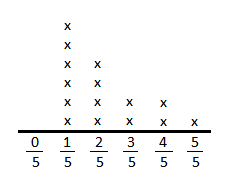
Represent this data in a line plot.
Answer:
Question 3.
What is the difference between the greatest distance ridden and the least distance ridden?
Answer:
The greatest ridden distance is \(\frac{5}{5}\) mi and the least distance ridden is \(\frac{1}{5}\).
Therefore, the difference between the greatest distance ridden and the least distance ridden will be \(\frac{5}{5}\)–\(\frac{1}{5}\) = \(\frac{4}{5}\)
Problem Solving
Question 4.
Mathematical PRACTICE Draw a Conclusion Walter practices piano for \(\frac{1}{4}\) hour, \(\frac{1}{2}\) hour, or \(\frac{3}{4}\) hour every other day. If a line plot shows two Xs above each value of time, what is the total amount of time Walter has spent practicing?
Answer:
The line plot described above is as shown below.
The total amount of time Walter has spent practicing will be \(\frac{1}{4}\) + \(\frac{1}{4}\) + \(\frac{2}{4}\) + \(\frac{2}{4}\) + \(\frac{3}{4}\) + \(\frac{3}{4}\) = \(\frac{12}{4}\)
Vocabulary Check
Question 5.
Describe one way to use a line plot.
Answer:
A line plot displays the frequency of a data on the number line.
Test Practice
Question 6.
Look at the tally chart or line plot from Exercise 2 above. What was the total distance ridden by all of the children?
(A) 5\(\frac{3}{5}\) hours
(B) 5\(\frac{4}{5}\) miles
(C) 6\(\frac{2}{5}\) miles
(D) 6\(\frac{3}{5}\) miles
Answer:
From the line chart or tally chart, we get the below information,
6×\(\frac{1}{5}\) = \(\frac{6}{5}\)
4×\(\frac{2}{5}\) = \(\frac{8}{5}\)
2×\(\frac{3}{5}\) = \(\frac{6}{5}\)
2×\(\frac{4}{5}\) = \(\frac{8}{5}\)
1×\(\frac{5}{5}\) = \(\frac{5}{5}\)
\(\frac{6}{5}\) + \(\frac{8}{5}\) + \(\frac{6}{5}\) + \(\frac{8}{5}\) + \(\frac{5}{5}\) = \(\frac{33}{5}\) or 6\(\frac{3}{5}\)
Therefore, option D is correct.