All the solutions provided in McGraw Hill My Math Grade 3 Answer Key PDF Chapter 12 Lesson 7 Collect and Display Measurement Data will give you a clear idea of the concepts.
McGraw-Hill My Math Grade 3 Answer Key Chapter 12 Lesson 7 Collect and Display Measurement Data
You can gather measurement data by finding the lengths of several objects. The data collected can be useful.
Math in My World
Example 1
Taylor is organizing a box of buttons by their size to the nearest half inch. Which size appears more often, \(\frac{1}{2}\) inch or 1 inch?
Measure the buttons below to the nearest half inch. Organize the data in the tally chart, and then display it in a line plot.
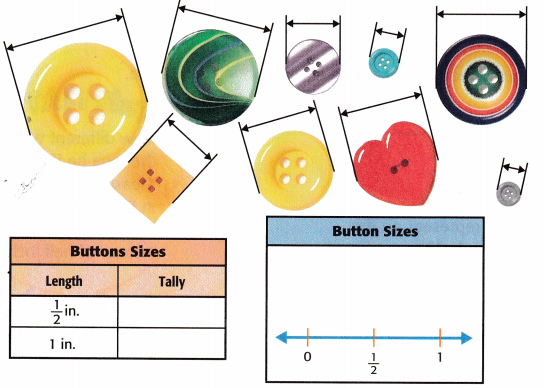
So, Taylor has more buttons that measure ____________ inch than \(\frac{1}{2}\) inch.
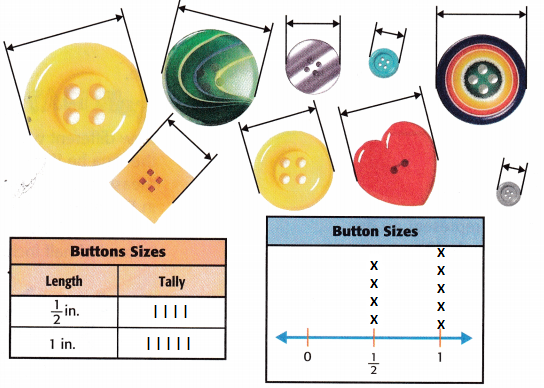
Answer:
So, Taylor has more buttons that measure 1 inch than \(\frac{1}{2}\) inch.
Example 2
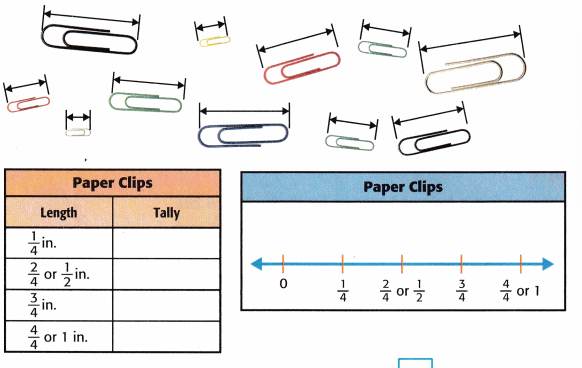
To the nearest \(\frac{1}{4}\) inch, of which size are there more paper clips?
Measure each paper clip to the nearest \(\frac{1}{4}\) inch. Organize the data in the tally chart, and then display it in a line plot.
So, there are equal amounts of all sizes except the ![]() -inch size.
-inch size.
Answer:
So, there are equal amounts of all sizes except the \(\frac{1}{4}\) inch.
Talk Math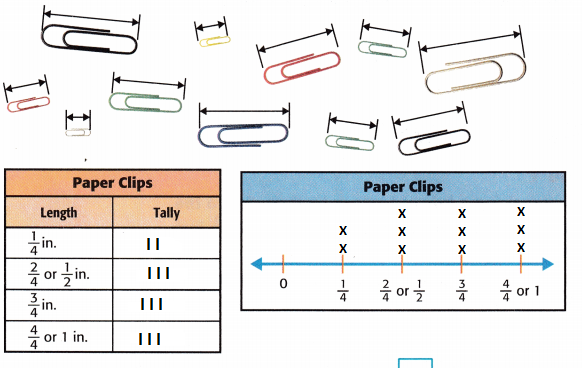
How different would the data be if the measurements taken in Example 1 were to the nearest inch, instead of half inch?

Answer:
If the measurements taken in Example 1 were to the nearest inch, instead of half inch, then all the clips would lie within 1 inch.Therefore, the total numbner of clips to nearest inch will be 2+3+3+3=11.
Guided Practice
Question 1.
What do the Xs represent on the line plot in Example 2?
Answer:
The number of paper clips that are fraction of an inch in length.
Independent Practice
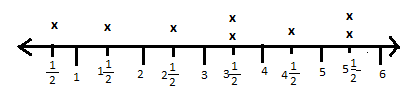
Measure eight friends’ pencils to the nearest inch.
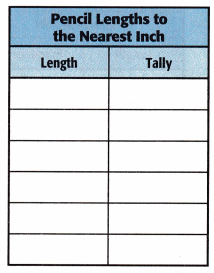
Question 2.
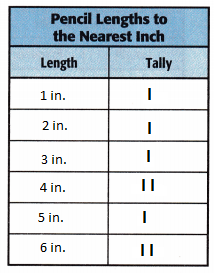
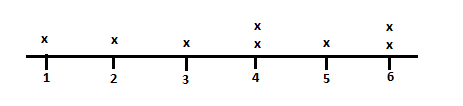
Organize the data in a tally chart, and then display it in a line plot.
![]()
Answer:
Question 3.
What is the difference in length between the longest and shortest pencil? Write an equation with the letter p for the unknown. Then solve.
Answer:
Let us assume the difference in length between the longest and shortest pencil will be p.
From the above data the length of shortest pencil is 1 inch and longest pencil is 6 inch.Therefore, the difference in length between the longest and shortest pencil will be 6-1=p=5 inches.
Question 4.
What would be the total length of the pencils if they were laid end to end?
Answer:
The total length of pencils will be sum of the different pencil lengths. Therefore, the total length will be 1+2+3+4+4+5+6+6=31 inches.
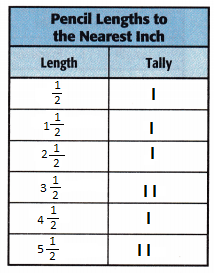
Question 5.
Use the same pencils. Measure them again but this time to the nearest half inch. Record and display your data.
![]()
Answer:
Question 6.
How are the two sets of data different? How are they alike?
Answer:
The two sets are the similar because they both show that majority of pencils lie between 3 and 6 inches.The second line plot looks different as the two pencils lie on 3\(\frac{1}{2}\) and 4\(\frac{1}{2}\) inches while in first plot they measure 4 and 6 inches.
Problem Solving
Question 7.
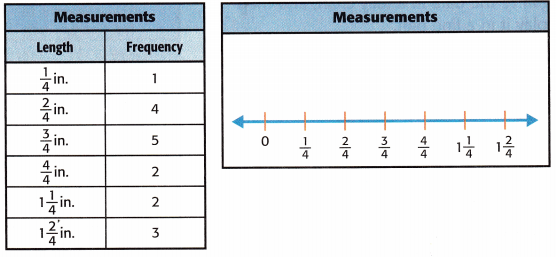
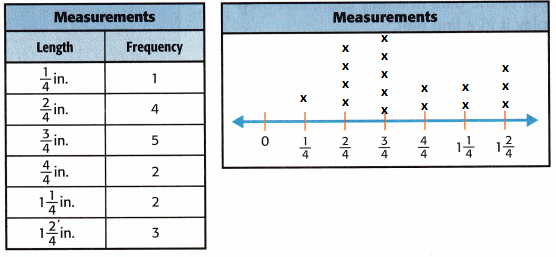
Several students measured small items from home. The frequency table shows they measured the items to the nearest quarter inch. Display the data in the line plot.
Answer:
Question 8.
What is the total number of items that measured 1 inch or less?
Answer:
From the above data,the total number of items that measured 1 inch or less will be 1+4+5+2=12 items.
Question 9.
Mathematical PRACTICE Use Algebra Write an equation that shows the difference between the total items that measured 1 inch or less and the total items that measure more than 1 inch. Then find the difference.
Answer:
Let us assume the difference between the total items that measured 1 inch or less and the total items that measure more than 1 inch be c.
The total items that measured 1 inch or less are 1+4+5+2=12 and the total items that measure more than 1 inch are 2+3=5.
Therefore, c will be 12-5=7.
HOT Problems
Question 10.
Mathematical PRACTICE Reason How is a ruler like the number line on the line plot in Exercise 7?
Answer:
The number line on the line plot resembles like the ruler.The line plot shows the fractions such as half-inch marks and one-fourth-inch marks.
Question 11.
Building on the Essential Question Why does recording measurement data lend itself to a line plot display?
Answer:
Each line plot will have a title and the numbers parts for measuring data dispalying on it.As shown in above examples, the mark on the line plot, will be helpful in knowing the frequency/count of each data.
McGraw Hill My Math Grade 3 Chapter 12 Lesson 7 My Homework Answer Key
Practice
Question 1.
Tell why in the line plot above, there are no Xs above \(\frac{3}{4}\) of an inch.
Answer:
There were no tallies in the tally chart for \(\frac{3}{4}\) inch. Therefore, there were no Xs above \(\frac{3}{4}\)inch.
Question 2.
Did more of Mrs. Carnes’ students grow an inch or more or less than an inch? Explain.
Answer:
Mrs. Carnes’ students grew more than an inch,\(\frac{4}{4}\) inch is one inch.So, 7 of 12 students grew an inch or more.
Question 3.
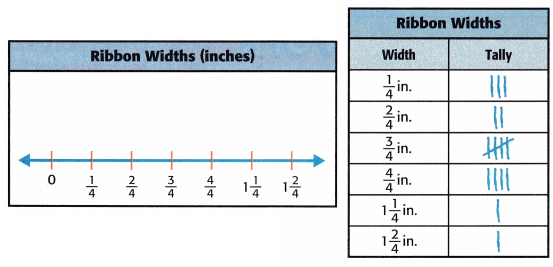
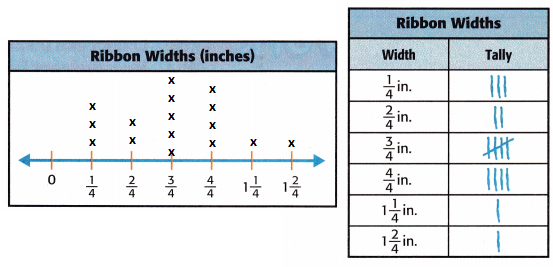
Ribbon can be bought in many different widths. The tally chart shows how many spools of each width of ribbon can be bought. Represent the measurement data in a line plot.
Answer:
Problem Solving
Question 4.
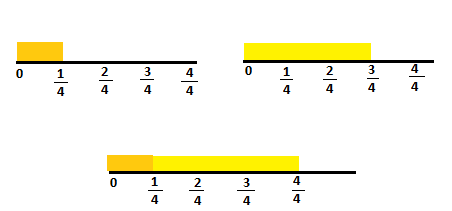
Mathematical PRACTICE Use Number Sense Which two widths, of different length, when put together will equal \(\frac{4}{4}\) of an inch or 1 whole inch?
Answer:
\(\frac{1}{4}\) and \(\frac{3}{4}\) are two different length which when put together will be equal to \(\frac{4}{4}\) of an inch or 1 whole inch.
\(\frac{1}{4}\)+\(\frac{3}{4}\) =\(\frac{4}{4}\) or 1 inch.
Question 5.
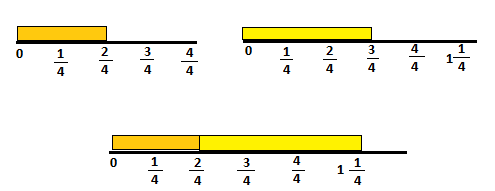
Which two widths, of different length, when put together will equal 1\(\frac{1}{4}\) inches? Explain.
Answer:
\(\frac{2}{4}\) and \(\frac{3}{4}\) are two different length which when put together will be equal to 1\(\frac{1}{4}\) of an inch or 1 whole inch.
\(\frac{2}{4}\)+\(\frac{3}{4}\) =1\(\frac{1}{4}\) inches.
Question 6.
Mathematical PRACTICE Make Sense of Problems Which has a greater combined width, two spools of ribbon that are each \(\frac{2}{4}\) inch in width, or one spool that is \(\frac{4}{4}\) inch in width? Explain.
Answer:
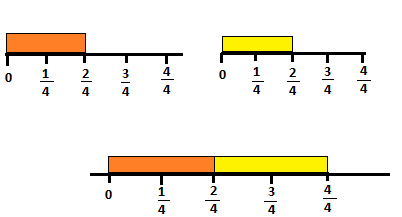
In the above figure, we can observe two spools of ribbon that are each \(\frac{2}{4}\) inch in width.
When the two spools of \(\frac{2}{4}\) are combined they form a spool of ribbon \(\frac{4}{4}\).
Therefore,two spools of ribbon that are each \(\frac{2}{4}\) inch in width, or one spool that is \(\frac{4}{4}\) inch in width will be equal.
Test Practice
Question 7.
How many spools of ribbon are represented in the line plot for Exercise 3?
(A) 1\(\frac{2}{4}\) spools
(B) 14 spools
(C) 15 spools
(D) 16 spools
Answer:
Number of spools represented in the line plot are 3+2+5+4+1+1=16.
Option D is correct.