All the solutions provided in McGraw Hill My Math Grade 3 Answer Key PDF Chapter 12 Lesson 3 Draw Scaled Bar Graphs will give you a clear idea of the concepts.
McGraw-Hill My Math Grade 3 Answer Key Chapter 12 Lesson 3 Draw Scaled Bar Graphs
A bar graph uses bars of different lengths or heights to show data. In Grade 2, you used a bar graph with a scale of 1. A scaled bar graph can use a scale greater than 1.
Math in My World
Example 1
Milo surveyed five grades to find the number of May birthdays. He recorded the data in a tally chart. Display the data in a vertical bar graph.
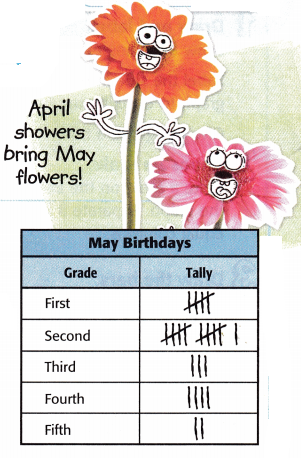
1. Draw and label.
Draw a rectangle.
Label the side and bottom of the graph to describe the information.
Give the graph a title.
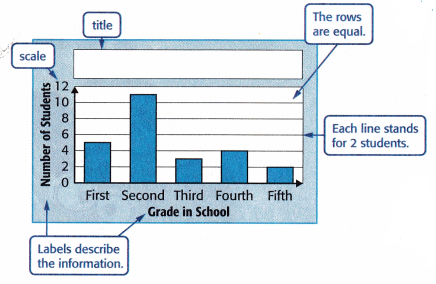
2. Choose a scale.
A scale is a set of numbers that represents the data organized into equal intervals.
3. Draw the bars.
Draw vertical bars to match the data.
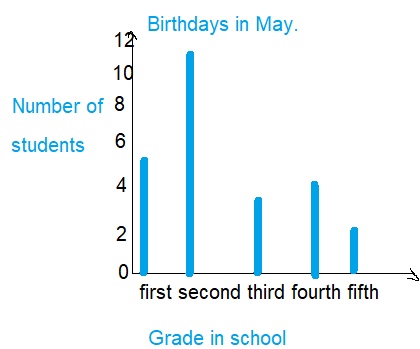
Answer:
From the given data we are drawing the vertical bar graph.
Example 2
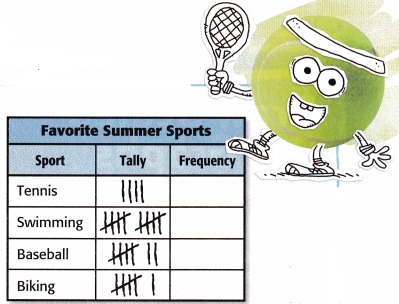
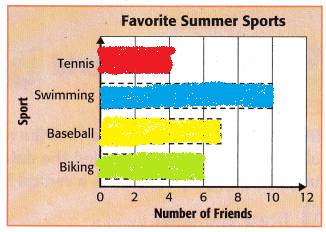
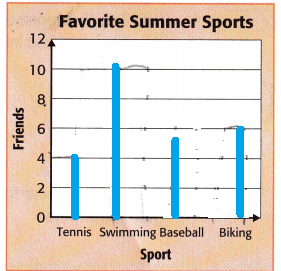
Desmond surveyed his friends about their favorite summer sports. Display the results in a horizontal bar graph.
1. Draw and label.
Draw a rectangle.
Label the side and bottom of the graph to describe the information.
Give the graph a title.
2. Choose a scale.
Write a scale on the bottom of the graph. Separate it into 6 equal columns.
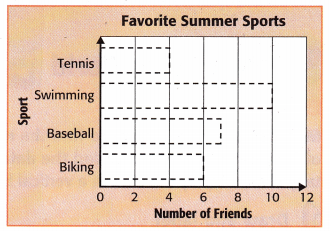
3. Draw the bars.
Draw horizontal bars to match each number from your data.
Answer:
The horizontal bar graph is drawn below with the given data.
Talk Math
How are horizontal and vertical bar graphs alike? How are they different?
Answer:
In the vertical bar graphs, the data is displayed on the y-axis, and in the horizontal bars, the data is displayed on the x-axis. both the graphs show the statistical data.
Guided Practice
Question 1.
Display the set of data from Example 2 in the vertical bar graph.
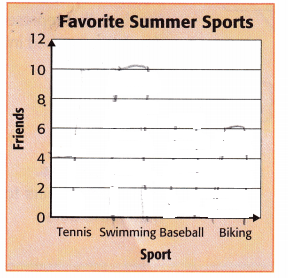
Answer:
Given that,
Friends on the tennis are 4
Friends in the swimming are 10
Friends on the Baseball is 5
Friends in the Biking is 6
The data is shown in the vertical graph.
Independent Practice
Display each set of data below in a bar graph.
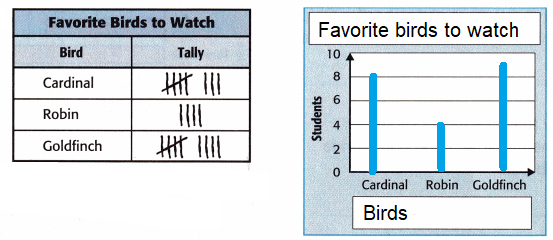
Question 2.
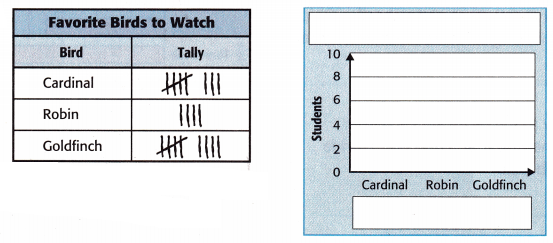
How many students responded to the survey altogether?
How many more students like watching the goldfinch than the robin?
Answer:
Given that,
The students who responded to the survey is 8 + 4 + 9 = 21.
The total number of students who like watching goldfish is 9.
The total number of students who like watching robin is 4.
Therefore the students like watching the goldfinch and the robin is 9 – 4 = 5.
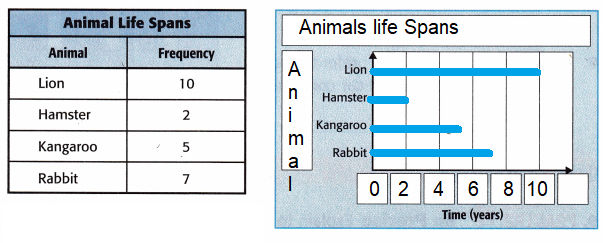
Question 3.
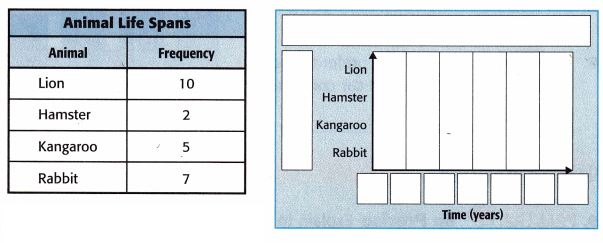
How many fewer years does the hamster live than the kangaroo?
Which two animals when you subtract their life spans will equal the life span of the hamster?
Answer:
Given that,
The life span of the lion is 10 years.
The life span of a Hamster is 2 years.
The life span of a Kangaroo is 5 years.
The life span of a Rabbit is 7 years.
Therefore the number of years that the hamster lives than the kangaroo is 5 – 2 = 3 years.
The subtraction of Kangaroo from Rabbit is 7 – 5 = 2.
It is equal to Hamster,
The subtraction of Kangaroo from Rabbit is equal to Hamster.
Question 4.
Write one sentence that describes the data in Exercise 3.
Answer:
The data in exercise 3 shows the life span of animals in the bar graph.
Problem Solving
Mathematical PRACTICE Use Math Tools Use the horizontal bar graph.
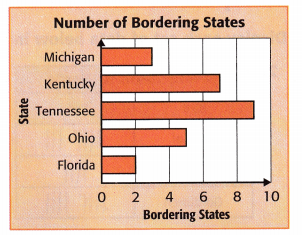
Question 5.
How many more states border Ohio than Michigan? Write a number sentence.
Answer:
Given that,
The number of Michigan borders is 3.
The number of Kentucky borders is 5
The number of Tennessee borders is 9
The number of Ohio borders is 5
The number of Florida borders is 2
Therefore the number of borders of Ohio than Michigan is 5 – 5 = 0.
Both the states have the same borders.
Question 6.
How many more states border Tennessee than Ohio and Florida combined?
Answer:
Given that,
The number of Michigan borders is 3.
The number of Kentucky borders is 5
The number of Tennessee borders is 9
The number of Ohio borders is 5
The number of Florida borders is 2
The number of Ohio and Florida combined is 5 + 2 = 7
Therefore Tennessee than Ohio and Florida combined is 9 – 7 = 2.
Use the vertical bar graph.
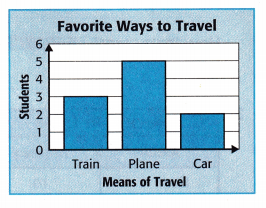
Question 7.
Write an addition equation to show the total number of students that were surveyed.
Answer:
Given that,
The total number of students on the train is 3.
The total number of students in the plane is 5.
The total number of students in the car is 2.
The addition equation for the total number of students in the survey is 3 + 5 + 2 = 10.
Question 8.
How many more students prefer to travel by plane than by train and car combined?
Answer:
Given that,
The total number of students on the train is 3.
The total number of students in the plane is 5.
The total number of students in the car is 2.
The total number of students in train and car combined is 3 + 2 = 5.
The people are preferring planes and trains and cars combined same.
HOT Problems
Question 9.
Mathematical PRACTICE Be Precise Explain to a friend the difference between the scales on the bar graphs on this page.
Answer:
The difference between the bar graph and scale is the bar graph is the vertical representation of data and the scale is used to measure the values.
Question 10.
Building on the Essential Question What factors help you determine the scale you will use for a bar graph?
Answer:
Choosing scales on the bar graph is for measuring the x-axis and y-axis and plotting the points on the graph accurately.
McGraw Hill My Math Grade 3 Chapter 12 Lesson 3 My Homework Answer Key
Practice
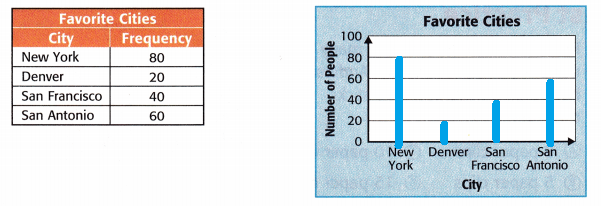
Question 1.
Display the set of data below in a vertical bar graph.
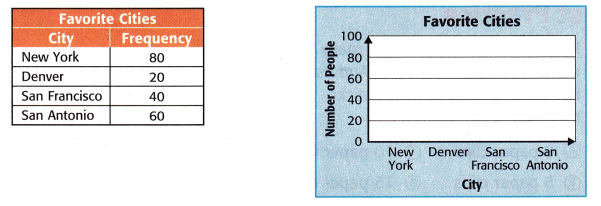
Answer:
Given that,
The total number of people in New York is 80.
The total number of people in Denver is 20.
The total number of people in San Francisco is 40.
The total number of people in San Antonio is 60.
The frequency of the people is drawn in the vertical graph.
Mathematical PRACTICE Model Math Display the data in a horizontal bar graph. Use the graph to answer Exercises 3-4.
Question 2.
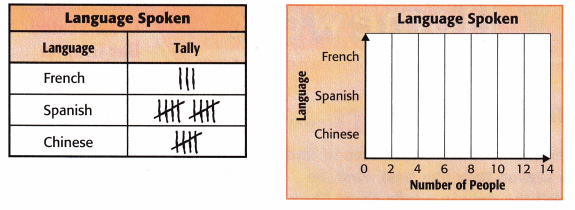
Answer:
Given that,
The French language spoken is 3.
The Spanish language spoken is 10.
The Chinese language spoken is 5.
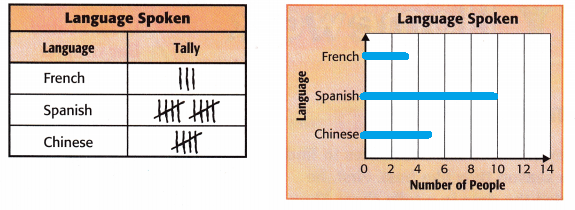
Question 3.
How many people participated in the survey?
Answer:
Given that,
The French language spoken is 3.
The Spanish language spoken is 10.
The Chinese language spoken is 5.
The total number of people participated in the survey is 10 + 3 + 5 = 18.
Therefore 18 people participated in the survey.
Question 4.
Mathematical PRACTICE Use Number Sense How many more people speak Spanish than Chinese and French combined?
Answer:
Given that,
The French language spoken is 3.
The Spanish language spoken is 10.
The Chinese language spoken is 5.
The people speaking French and Chinese is 3 + 5 = 8.
The number of people who speak Spanish than Chinese and French is 10 – 8 = 2
Therefore 2 people are speaking French than Chinese and French.
Vocabulary Check
Write the definition of each.
Question 5.
bar graph ______________
Answer:
The bar graph is the graphical representation of data in which values are shown in horizontal or vertical bars.
Question 6.
scale _______________
Answer:
A scale is a tool or mechanism by which individuals are distributed as to how they differ from one another on the variables of interest to the study.
Test Practice
Question 7.
Refer to the bar graph. How many more paper clips does Mrs. Anderson have than pencils and glue sticks together?
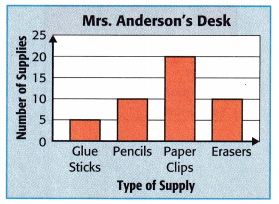
(A) 0 paper clips
(B) 5 paper clips
(C) 10 paper clips
(D) 15 paper clips
Answer:
Given that,
The total number of Glue sticks is 5.
The total number of pencils is 10.
The total number of paper clips is 20.
The total number of Erasers is 10.
The total number of pencils and Glue sticks together is 10 + 5 = 15.
Therefore 5 paper clips are more than pencils and Glue sticks together.
Option B is the correct answer.