All the solutions provided in McGraw Hill My Math Grade 2 Answer Key PDF Chapter 9 Lesson 5 Analyze Bar Graphs will give you a clear idea of the concepts.
McGraw-Hill My Math Grade 2 Answer Key Chapter 9 Lesson 5 Analyze Bar Graphs
Explore and Explain
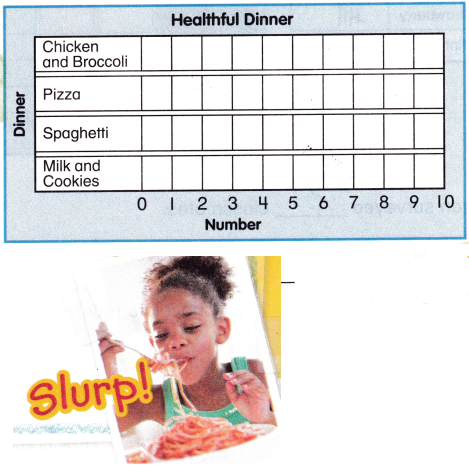
chicken and broccoli _______________
pizza _______________
spaghetti _______________
milk and cookies _______________
Teacher Directions: Survey 10 people. Ask them which dinner is the healthiest. Make a bar graph. Write how many votes each dinner got.
Answer: Chicken and Broccoli got the highest votes
Explanation:
From the given data,
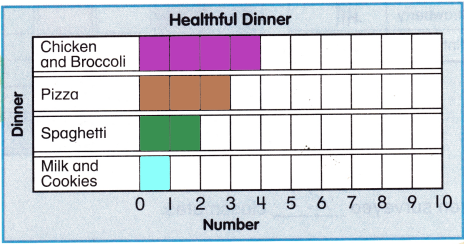
Here, chicken and broccoli got 4 votes
Pizza got 3 votes
Spaghetti got 2 votes
milk and cookies got 1 vote
So, Chicken and Broccoli got the highest votes
See and Show
Owen surveyed his class about their favorite ice cream flavors. Then he made a bar graph to show the data.
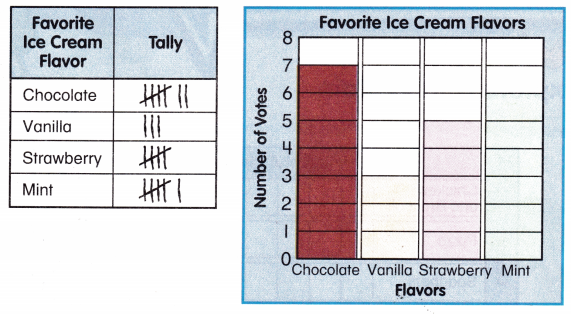
Owen surveyed ![]() classmates.
classmates.
Use the bar graph above to complete the sentences.
Question 1.
The flavor with the least votes is _______________.
Answer: Vanilla has the least votes.
Explanation:
From the given bar graph,
chocolate got 7 votes,
vanilla got 3 votes,
Strawberry got 5 votes,
Mint got 6 votes.
So, Vanilla has the least votes.
Question 2.
Chocolate received 2 more votes than ______________.
Answer: Chocolate received 2 more votes than Strawberry
Explanation:
From the given tally chart,
chocolate got 7 votes,
Strawberry got 5 votes,
So, Chocolate received 2 more votes than Strawberry
Question 3.
What two flavors did eleven students vote for?
Answer: Strawberry and Mint are flavors 11 students have voted
Explanation:
From the given tally chart,
Strawberry got 5 votes,
Mint got 6 votes.
So, Strawberry and Mint are flavors 11 students have voted .
Talk Math How could this graph help a teacher plan a class party?
Answer: Because the teacher knows which flavor has the highest votes
Explanation:
From the given bar graph,
chocolate got 7 votes,
vanilla got 3 votes,
Strawberry got 5 votes,
Mint got 6 votes.
So, the teacher knows which flavor has the highest votes and can arrange a class party.
On My Own
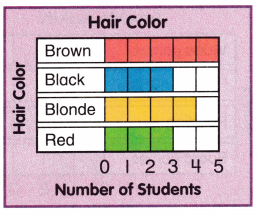
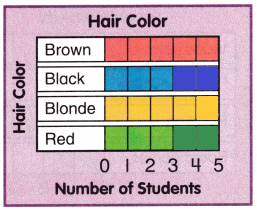
Use the bar graph to answer the questions.
Question 4.
What color hair do 5 students have?
Answer: 5 students have brown color
Explanation:
From the given bar graph,
brown got 5 votes,
black got 3 votes,
blonde got 4 votes,
Red got 3 votes,
So, 5 students have brown color.
Question 5.
What color hair do 4 students have?
Answer: 4 students have blonde color
Explanation:
from the given bar graph,
brown got 5 votes,
black got 3 votes,
blonde got 4 votes,
Red got 3 votes,
So, 4 students have blonde color.
Question 6.
What two hair colors do the same number of students have?
Answer: Black and red are the colors same number of students have.
Explanation:
from the given bar graph,
brown got 5 votes,
black got 3 votes,
blonde got 4 votes,
Red got 3 votes,
so, Black and red are the colors same number of students have.
Question 7.
How many students were surveyed?
Answer: 15 students were surveyed
Explanation:
from the given bar graph,
brown got 5 votes,
black got 3 votes,
blonde got 4 votes,
Red got 3 votes,
So, 15 students were surveyed.
Question 8.
How would this graph change if 20 students took the survey?
Answer: all the colors will get equal votes
Explanation:
from the given bar graph,
brown got 5 votes,
black got 5 votes,
blonde got 5 votes,
Red got 5 votes,
So, all the colors will get equal votes
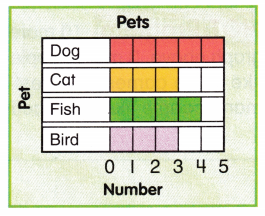
Question 9.
Which pet do most students have?
Answer: Most of the students have Dog as a pet
Explanation:
From the given bar graph
Dog got 5 votes,
Cat got 3 votes,
Fish got 4 votes,
Bird got 3 votes,
So, Most of the students have Dog as a pet.
Question 10.
Which two pets do the fewest students have?
Answer: cat and bird are pets owned by fewest students.
Explanation:
From the given bar graph
Dog got 5 votes,
Cat got 3 votes,
Fish got 4 votes,
Bird got 3 votes,
So, cat and bird are pets owned by fewest students.
Question 11.
How many students have cats and birds?
Answer: 6 students have cats and birds
Explanation:
From the given bar graph
Cat got 3 votes,
Bird got 3 votes,
So, 6 students have cats and birds
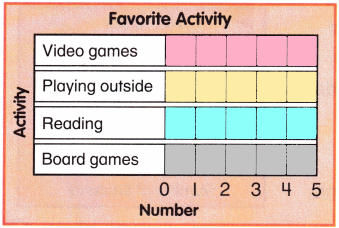
Problem Solving
Use the bar graph to answer the questions.
Question 12.
How many more people like reading or board games than playing video games?
Answer: 3 more people like reading or board games than playing video games.
Explanation:
From the bar graph,
video games got 3 votes,
playing outside got 3 votes,
reading got 4 votes,
playing video games got 2 votes,
So, 3 more people like reading or board games than playing video games.
Question 13.
Samantha changes her vote from playing outside to reading. Which activity is the class favorite now?
Answer: Still the favorite activity will be reading
Explanation:
From the bar graph,
video games got 3 votes,
playing outside got 3 votes,
reading got 4 votes,
playing video games got 2 votes,
If Samantha changes her vote from playing outside to reading.
reading got 5 votes,
So, Still the favorite activity will be reading .
HOT Problem 10 more people were surveyed for the graph above. 3 more people like board games. 3 more people like video games. The rest like playing outside. Now how many people like each activity?
Answer: All of them got equal votes
Explanation:
All of them got equal votes
McGraw Hill My Math Grade 2 Chapter 9 Lesson 5 My Homework Answer Key
Practice
Use the bar graph to answer the questions.
Question 1.
How many people voted for mustard?
Answer: 4 people voted for mustard
Explanation:
From the given, bar graph
3 people voted for Onion
4 people voted for Mustard
5 people voted for Ketchup
So, 4 people voted for mustard
Question 2.
What topping do most people like?
Answer: Most people like Ketchup as their topping
Explanation:
From the given, bar graph
3 people voted for Onion
4 people voted for Mustard
5 people voted for Ketchup
So, Most people like Ketchup as their topping
Question 3.
Which topping is liked the least?
Answer: The least liked topping is Onion
Explanation:
From the given, bar graph
3 people voted for Onion
4 people voted for Mustard
5 people voted for Ketchup
So, The least liked topping is Onion
Question 4.
How many people like mustard or onion?
Answer: 4 people like Mustard and 3 people like Onion
Explanation:
From the given, bar graph
3 people voted for Onion
4 people voted for Mustard
5 people voted for Ketchup
So, people like Mustard and 3 people like Onion
Use the bar graph to answer the questions.

Question 5.
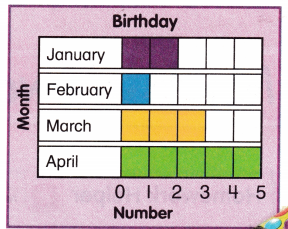
How many people have April birthdays?
Answer: 5 people have April birthdays
Explanation:
From the bar graph ,
January got 2 votes
February got 1 vote
March got 3 votes,
April got 5 votes,
So, 5 people have April birthdays
Question 6.
How many birthdays are in February and March?
Answer: February and March have 4 birthdays
Explanation:
From the bar graph ,
February got 1 vote
March got 3 votes,
So, February and March got 4 votes
Question 7.
How many people were surveyed in all?
Answer: 12 people were surveyed in all
Explanation:
From the bar graph ,
January got 2 votes
February got 1 vote
March got 3 votes,
April got 5 votes,
So, 12 people were surveyed in all
Question 8.
Four more people answered the survey. They all had February birthdays. Which month has the most birthdays now?
Answer: February and April has most birthdays
Explanation:
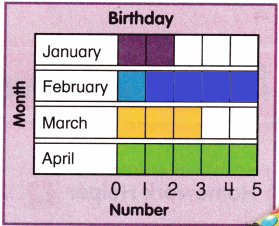
From the bar graph and given data
Four more people answered the survey.
They all had February birthdays
February got 5 votes and April got 5 votes.
So, February and April has most birthdays
Test Practice
Question 9.
How many c?
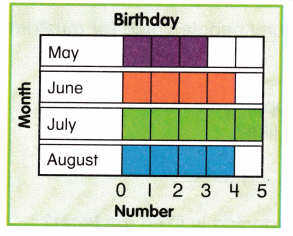
(A) 8
(B) 7
(C) 4
(D) 3
Answer: B
Explanation:
From the given bar graph
may got 3 votes
June got 4 votes,
July got 5 votes ,
August got 4 votes,
So, 7 birthdays are there in May and August.