All the solutions provided in McGraw Hill My Math Grade 2 Answer Key PDF Chapter 11 Lesson 12 Measurement Data will give you a clear idea of the concepts.
McGraw-Hill My Math Grade 2 Answer Key Chapter 11 Lesson 12 Measurement Data
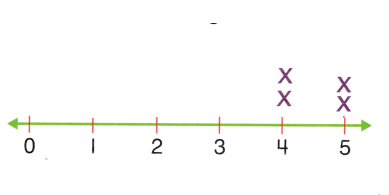
Explore and Explain
Teacher Directions: Measure five of your classmates’ pencils with a ruler. Make a line plot using the data from your measurements.
Answer:
See and Show
Helpful Hint
Remember a line plot tells how many times a number occurs in data.

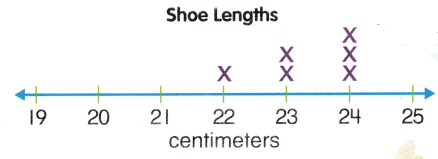
How many people have shoes that are 23 centimeters long? ![]()
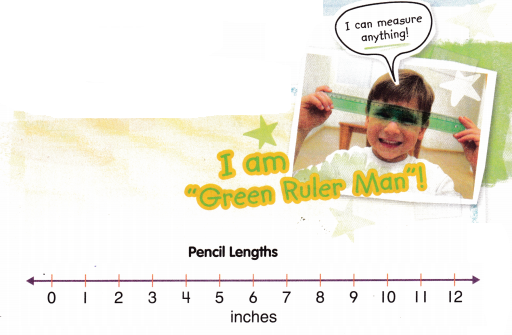
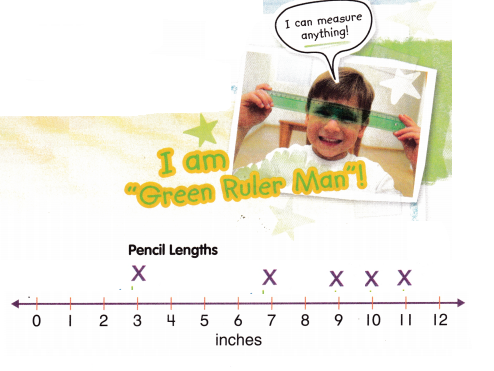
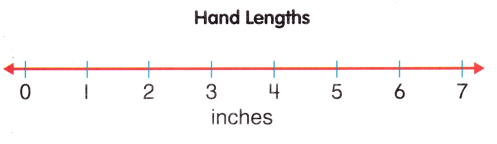
Measure the length of the right hand of 10 people in inches. Use the data to make a line plot.
Answer:
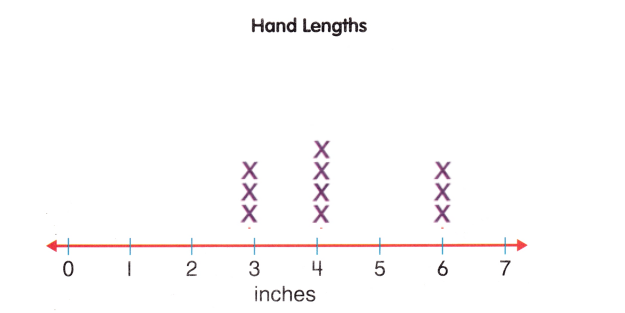
Question 1.
How long are most of the hands?
_____________ inches
Answer:
4 inches long
Explanation:
Most of the hands are 4 inches long
Question 2.
How long is the longest hand?
_____________ inches
Answer:
6 inches
Explanation:
The longest hand is 6 inches long
Talk Math How does a line plot help to show measurement data?
Answer:
Line plot can be defined as a graph that displays data as points or check marks above a number line, showing the frequency of each value.
On My Own
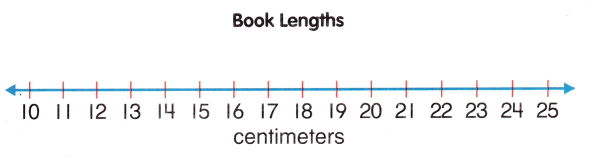
Measure 15 books from your classroom library in centimeters. Use the data to make a line plot.
Answer:
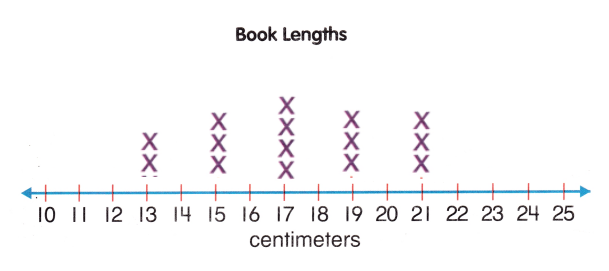
Question 3.
How long are most books?
_______________ centimeters
Answer:
17 centimeters long
Explanation:
The most books are 17 centimeters long
Question 4.
How long is the longest book?
_______________ centimeters
Answer:
21 centimeters
Explanation:
The longest book is 21 centimeters long
Measure 15 used crayons in inches. Use the data to make a line plot.

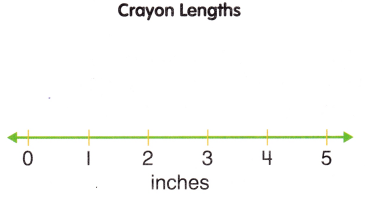
Answer:
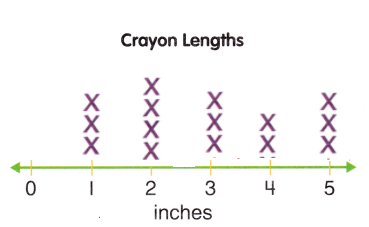
Question 5.
How short is the shortest crayon?
______________ inches
Answer:
1 inch
Explanation:
The shortest crayon is 1 inch long.
Question 6.
How long is the longest crayon?
_______________ inches
Answer:
5 inches
Explanation:
The longest crayon is 5 inches long
Problem Solving
Question 7.
A line plot shows that 12 people are 48 inches tall, 8 people are 50 inches tall, and 9 people are 47 inches tall. How tall are most of the people?
______________ inches
Answer:
Most of the people are 50 inch tall.
Explanation:
A line plot shows that 12 people are 48 inches tall,
8 people are 50 inches tall,
and 9 people are 47 inches tall.
50 inches tall are most of the people
Question 8.
Four snakes are 20 inches, 2 snakes are 32 inches, and 4 snakes are 15 inches. What is the difference in length between the longest and the shortest snake?
______________ inches
Answer:
17 inches.
Explanation:
Four snakes are 20 inches,
2 snakes are 32 inches,
and 4 snakes are 15 inches.
32 – 15 = 17
17 inches is the difference in length between the longest and the shortest snake.
Question 9.
Four people went down the slide 8 times. Eight people went down the slide 6 times. Two people went down the slide 12 times. How many times did most people go down the slide?
_____________ times
Answer:
6 times
Explanation:
Four people went down the slide 8 times.
Eight people went down the slide 6 times.
Two people went down the slide 12 times.
most of the people go 6 times
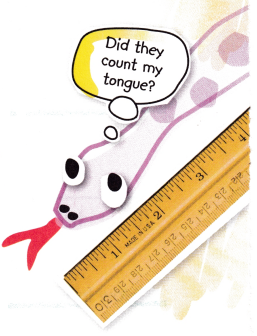
HOT Problem Jordan mode a line plot of the heights of his 5 pets. The same number of pets are 14 inches and 18 inches tall. One pet is 6 inches tall. How many pets are 14 inches tall?
Answer:
2 pets are 14 inches tall
2 + 2 + 1 = 5
2 pets 14 inches
2 pets 18 inches and
1 pet is 6 inches tall.
McGraw Hill My Math Grade 2 Chapter 11 Lesson 12 My Homework Answer Key
Practice
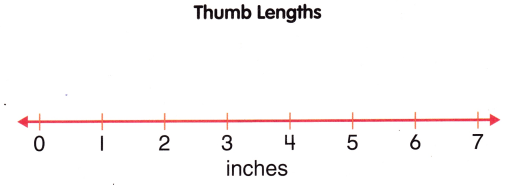
Measure the thumb length of each of your family members. Use the data to make a line plot.
Helpful Hint
Line plots show how often a number occurs in data.
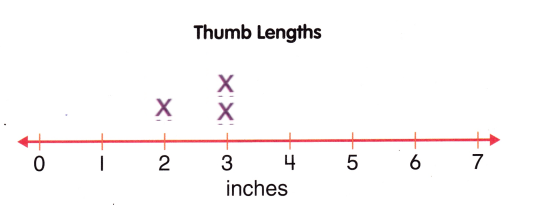
Question 1.
How long is the longest thumb?
_____________ inches
Answer:
3 inches
Explanation:
The longest thumb is 3 inches long
Question 2.
How short is the shortest thumb?
____________ inches
Answer:
2 inches
Explanation:
The shortest thumb is 2 inches long
Question 3.
Make a line plot to show how tall each flower is. Four flowers are 10 centimeters, 3 flowers are 13 centimeters, and 6 flowers are 17 centimeters.
Answer:
Question 4.
Grace ran 50 meters 3 times, she ran 100 meters 2 times, and she ran 150 meters 1 time. How far did she run most of the time?

_____________ meters
Answer:
50 meters
Explanation:
Grace ran 50 meters 3 times,
she ran 100 meters 2 times,
and she ran 150 meters 1 time.
so, she ran most 50 times
Test Practice
Question 5.
Use the line plot below to answer the question. How long are most toes?
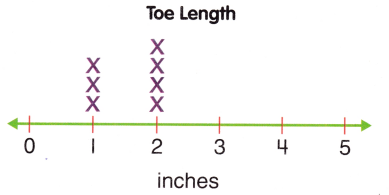
(A) 1 centimeter
(B) 1 inch
(C) 2 centimeters
(D) 2 inches
Answer:
B
Explanation:
The most of the toes are 1 inch long
Math at Home Have your child create a line plot a show the heights of everyone in your family.
Answer: