All the solutions provided in McGraw Hill My Math Grade 1 Answer Key PDF Chapter 7 Lesson 6 Read Bar Graphs will give you a clear idea of the concepts.
McGraw-Hill My Math Grade 1 Answer Key Chapter 7 Lesson 6 Read Bar Graphs
Explore and Explain
_____________ people
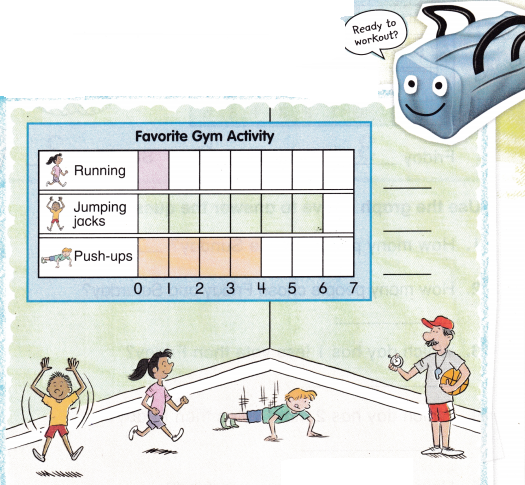
Teacher Directions: Use ![]() to show the number of people who chose their favorite gym activity. Write how many people chose each gym activity. Write how many people were surveyed in all.
to show the number of people who chose their favorite gym activity. Write how many people chose each gym activity. Write how many people were surveyed in all.
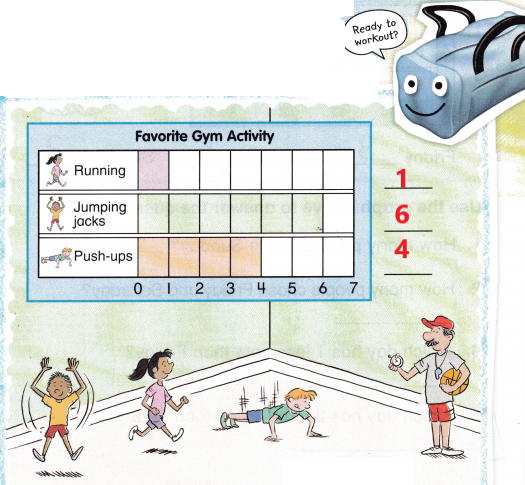
Answer:
Explanation:
1 person chose running
6 people chose jumping jacks
4 people chose push-ups
Add 1, 6, and 4 to find the total
1 + 6 + 4 = 11
So, 11 people are surveyed in all.
See and Show
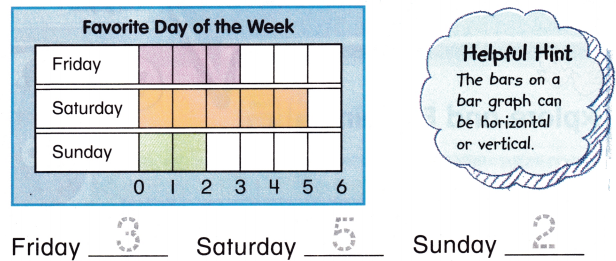
The bars on a bar graph tell how many. Look where each bar ends. Read the number.
Use the graph above to answer the questions.
Question 1.
How many people chose Sunday?
Answer:
2
Explanation:
2 chose Sunday.
Question 2.
How many people chose Friday and Saturday?
Answer:
8
Explanation:
3 chose Friday
5 chose Saturday
Add
3 + 5 = 8
So, 8 people chose Friday and Saturday.
Question 3.
Which day has 1 less vote than Friday?
Answer:
Sunday
Explanation:
3 chose Friday
1 less than 3 is 2
2 chose Sunday
So, Sunday has 1 vote less than Friday.
Question 4.
Which day has 2 more votes than Friday?
Answer:
Saturday
Explanation:
3 chose Friday
2 more than 3 is 5
5 chose Saturday
So, Saturday has 2 more vote than Friday.
Question 5.
How many people were surveyed?
Answer:
10
Explanation:
3 chose Friday
5 chose Saturday
2 chose Sunday
Add
3 + 5 + 2 = 10
So, 10 people were surveyed in all.
Talk Math Why is the graph above called a bar graph?
Answer:
The above graph is called a bar graph as the data in the above graph is represented using bars.
On Your Own
Use the graph to answer the questions.
Question 6.
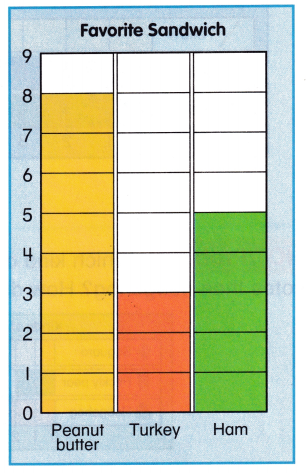
How many people chose turkey?
Answer:
3 people
Explanation:
3 people chose turkey.
Question 7.
How many more people chose peanut butter than turkey?
Answer:
5 people
Explanation:
3 people chose turkey
8 people chose peanut butter
Subtract to find
8 – 3 = 5
So, 5 more people chose peanut butter than turkey.
Question 8.
Did more people choose ham or turkey?
Answer:
Ham
Explanation:
3 people chose turkey
5 people chose ham
5 > 3
So, more people chose ham than turkey.
Question 9.
Which kind of sandwich is liked better than ham?
Answer:
Peanut butter
Explanation:
8 people chose peanut butter
5 people chose ham
8 > 5
So, peanut butter sandwich is liked better than ham.
Question 10.
Did fewer people choose peanut butter or turkey?
Answer:
Turkey
Explanation:
8 people chose peanut butter
3 chose turkey
3 < 8
So, fewer people chose turkey.
Question 11.
How many people were surveyed?
Answer:
16 people
Explanation:
8 people chose peanut butter
3 chose turkey
5 people chose ham
Add
8 + 3 + 5 = 16
So, 16 people surveyed in all.
Problem Solving
Question 12.
A class made a bar graph about what color of pencils they used. Which pencil color got less votes than green?
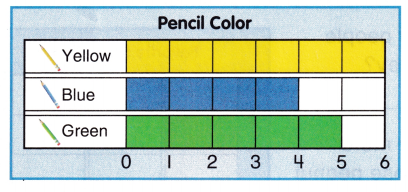
Answer:
Blue
Explanation:
6 students used yellow color pencil
4 students used yellow color pencil
5 students used yellow color pencil
4 < 5
So, blue pencil color got less vote than green.
HOT Problem Which kind of cacti has more votes than hedgehog? How do you know?
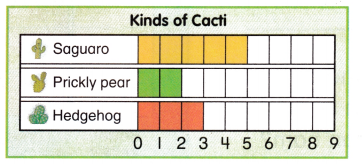
Answer:
Saguaro
Explanation:
Saguaro has 5 votes
Prickly pear has 2 votes
Hedgehog has 3 votes
5 > 3
So, Saguaro has more votes than hedgehog.
McGraw Hill My Math Grade 1 Chapter 7 Lesson 6 My Homework Answer Key
Practice
Use the graph to answer the questions.
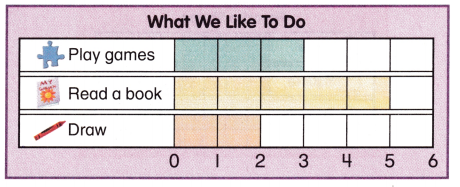
Question 1.
How many students like to draw?
Answer:
2
Explanation:
2 students like to draw.
Question 2.
Which activity got fewer votes than playing games?
Answer:
Drawing activity
Explanation:
2 students like to do drawing
3 students like to play games
2 < 3
So, drawing got fewer vote than playing games.
Use the graph to answer the questions.
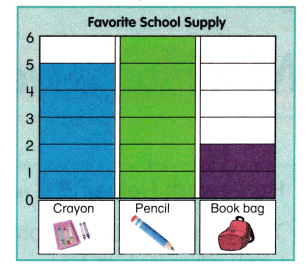
Question 3.
How many students voted for pencil?
Answer:
6
Explanation:
6 students voted for pencil.
Question 4.
Which school supply got fewer than 3 votes?
Answer:
Book bag
Explanation:
5 students voted for crayons
6 students voted for pencil
2 students voted for book bag
2 < 3
So, book bag got fewer votes than 3 votes.
Question 5.
How many more students voted for pencil than for book bag?
Answer:
4
Explanation:
6 students voted for pencil
2 students voted for book bag
Subtract to find
6 – 2 = 4
So, 4 more students voted for pencil than for book bag.
Question 6.
How many students were surveyed in all?
Answer:
13 students
Explanation:
5 students voted for crayons
6 students voted for pencil
2 students voted for book bag
Add to find
5 + 6 + 2 = 13
So, 13 students were surveyed in all.
Test Practice
Question 7.
How many people were surveyed in all?
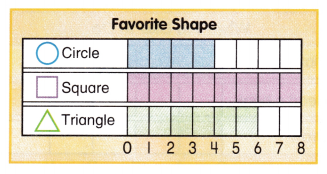
(A) 20
(B) 18
(C) 8
(D) 6
Answer:
(B) 18
Explanation:
4 voted for circle
8 voted for square
6 voted for triangle
Add to find total
4 + 8 + 6 = 18
So, 18 people were surveyed in all.
Math at Home Create a bar graph showing your family members’ favorite season. Ask your child questions about this bar graph.
Answer: