All the solutions provided in McGraw Hill My Math Grade 1 Answer Key PDF Chapter 7 Lesson 3 Make Picture Graphs will give you a clear idea of the concepts.
McGraw-Hill My Math Grade 1 Answer Key Chapter 7 Lesson 3 Make Picture Graphs
Explore and Explain
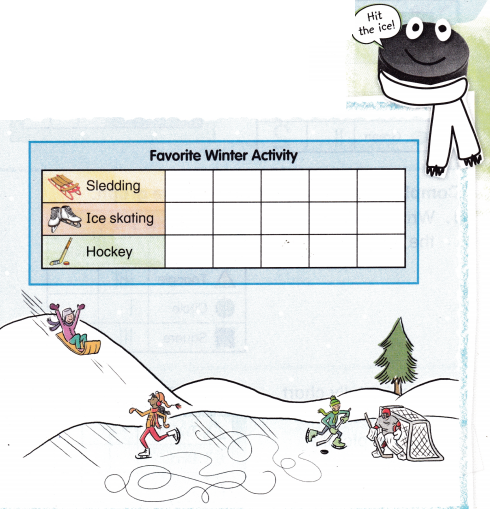
Teacher Directions: Ask 5 students to vote for their favorite winter activity. Show these votes by drawing circles in the boxes.
Answer:
Explanation:
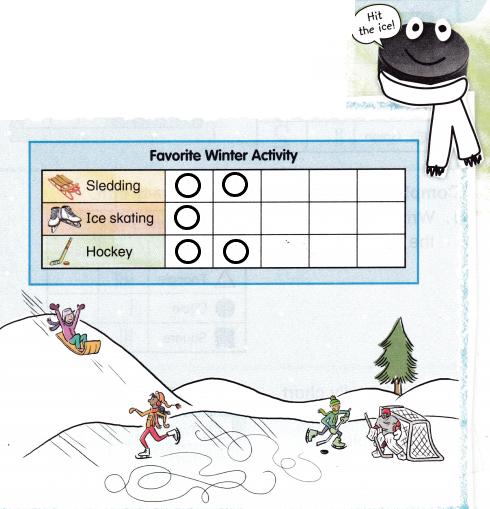
I asked 5 students to vote for their favorite winter activity
I drew circles to show their choices
2 students chose sledding
1 student chose ice skating
2 students chose hockey.
See and Show
A graph shows information or data. A picture graph uses pictures to show data. You can use a tally chart to make a picture graph.
Complete the tally chart and picture graph.
Question 1.
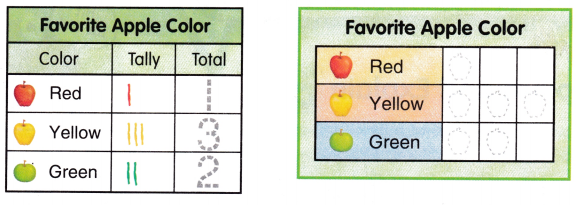
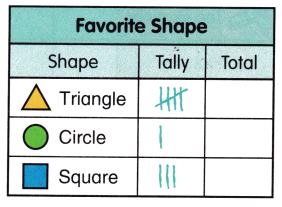
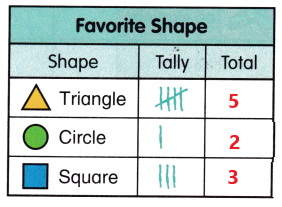
Write the totals in the tally chart.
Answer:
Explanation:
I counted the tally marks and wrote the numbers in the tally chart.
Question 2.
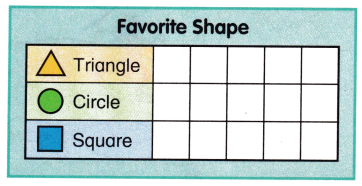
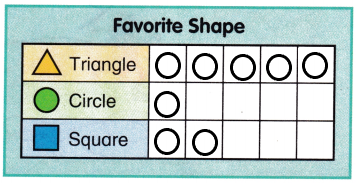
Use the tally chart in Exercise 1 to make a picture graph.
Answer:
Explanation:
There are 5 triangles
There is 1 circle
There are 2 squares
I drew circles in the picture graph to show the number.
Talk Math What is a picture graph? Describe it.
Answer:
A picture graph uses symbols and pictures to represent data
It uses scale to represent the data or information provided.
On Your Own
Complete the tally chart and picture graph.
Question 3.
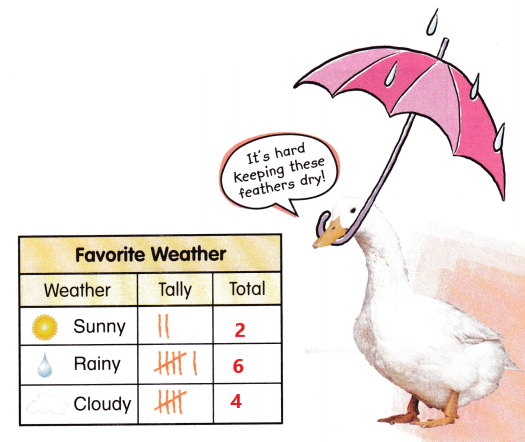
Write the totals ¡n the tally chart.

Answer:
Explanation:
I counted the tally marks and wrote the numbers in the tally chart.
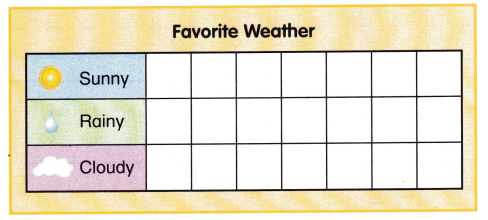
Question 4.
Use the tally chart in Exercise 3 to make a picture graph.
Answer:
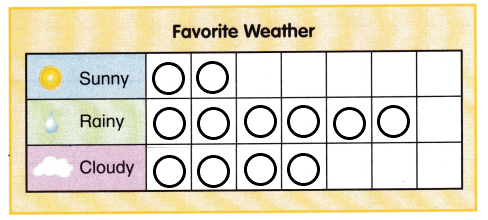
Explanation:
2 people like sunny weather
6 people like rainy weather
4 people like cloudy weather
So, i drew circles to show the favorite weather of the people.
Problem Solving
Complete the picture graph.
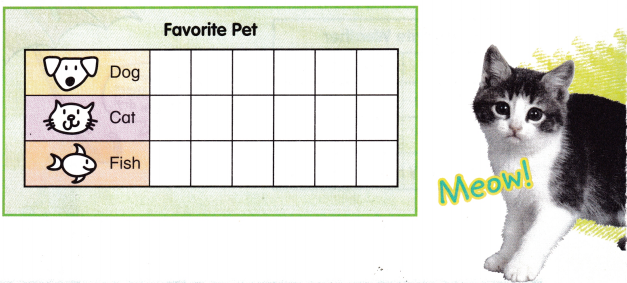
Question 5.
Miguel asks his friends to name their favorite pet. 3 people like fish. 2 fewer people like cats. 4 people like dogs.
Answer:
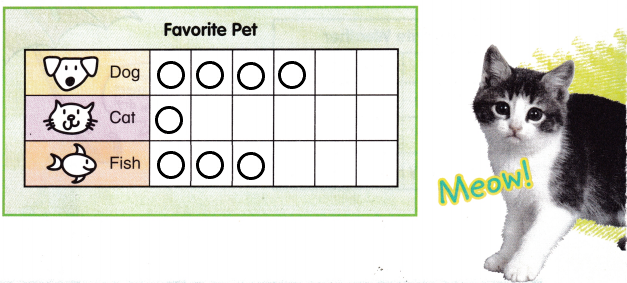
Explanation:
Miguel asks his friends to name their favorite pet
3 people like fish
2 fewer people like cats
4 people like dogs
I drew circles to show the favorite pet of Miguel and his friends.
Write Math How does a picture show a number on the graph? Explain.
Answer:
A picture graph uses symbols and pictures to represent data.
Example:
The pictograph shows data on the number of pens sold on each day using a pen picture
Scale 1 pen picture means 5 pens sold.
McGraw Hill My Math Grade 1 Chapter 7 Lesson 3 My Homework Answer Key
Practice
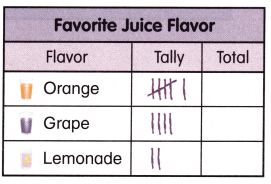
Question 1.
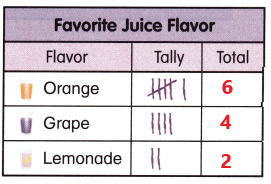
Write the totals in the tally chart.
Answer:
Explanation:
I counted the tally marks and wrote the numbers in the tally chart.
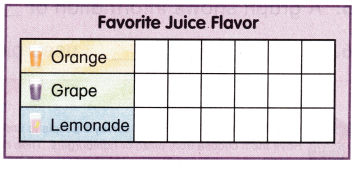
Question 2.
Use the tally chart in Exercise I to make a picture graph.
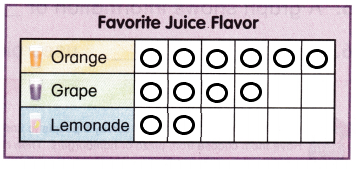
Answer:
Explanation:
6 people like orange juice
4 people like grape juice
2 people like lemonade
So, i drew circles against each juice to show the favorite juice of people.
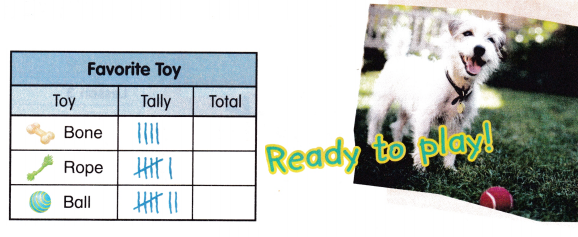
Question 3.
Write the totals in the tally chart.
Answer:
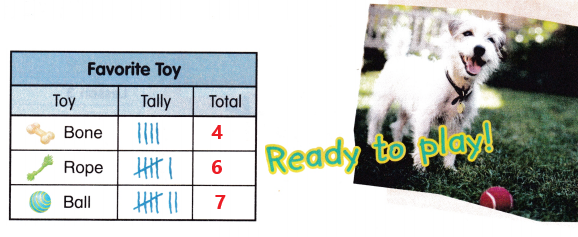
Explanation:
I counted the tally marks and wrote the numbers in the tally chart.
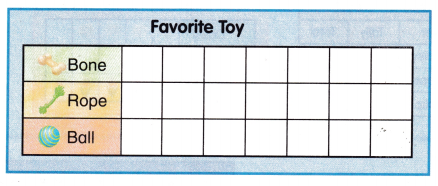
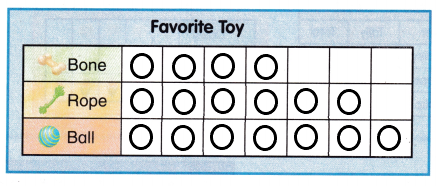
Question 4.
Use the tally chart in Exercise 3 to make a picture graph.
Answer:
Explanation:
4 dogs like to play with bone
6 dogs like to play with rope
7 dogs like to play with ball
So, i drew circles against each toy to show the favorite toy of dogs.
Vocabulary Check
Complete each sentence.
data
picture graph
Question 5.
A graph shows information or _____________.
Answer:
A graph shows information or data.
Question 6.
A _______________ uses pictures to show data.
Answer:
A picture graph uses pictures to show data.
Math at Home Help your child survey 5 people to find their favorite dinner food. Have them choose from pizza or hamburgers. Then help your child make a picture graph to show this information.
Answer: