We included HMH Into Math Grade 8 Answer Key PDF Module 9 Review to make students experts in learning maths.
HMH Into Math Grade 8 Module 9 Review Answer Key
Vocabulary
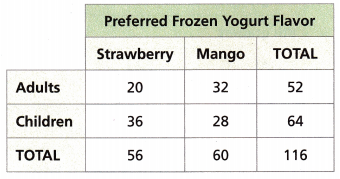
For Problems 1-3, tell whether each description represents a joint, marginal, or conditional relative frequency for the two-way table.
Question 1.
the ratio of the number of people who chose mango to the total number of people surveyed
Answer:
Marginal frequency,
Explanation:
As the ratio of the number of people who chose mango t the total number of people surveyed it is marginal frequency because as marginal relative frequency is the ratio of the sum of the joint relative frequency in a row or column and the total number of data values.
Question 2.
the ratio of the number of children who chose strawberry to the total number of people who chose strawberry
Answer:
Joint frequency,
Explanation:
As the ratio of the number of children who chose strawberry to the total number of people who chose
strawberry is joint frequency, A joint relative frequency tells us the frequency of one variable relative to another variable. Joint relative frequency is the ratio of a frequency that is not in the total row or the total column to the total number of values or observations.
Question 3.
the ratio of the number of adults who chose strawberry to the total number of people surveyed
Answer:
Marginal frequency,
Explanation:
As the ratio of the number of adults who chose strawberry to the total number of people surveyed it is marginal frequency because as marginal relative frequency is the ratio of the sum of the joint relative frequency in a row or column and the total number of data values.
Question 4.
What does it mean when a two-way table shows an association between two data sets?
Answer:
An association between the categorical variables exists means the relative frequencies are not similar in value,
Explanation:
An “association” exists between two categorical variables if the row (or column) conditional relative frequencies are different for the rows (or columns) of the table.
The bigger the differences in the conditional relative frequencies, the stronger the association between the variables.
Concepts and Skills
Question 5.
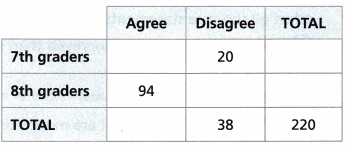
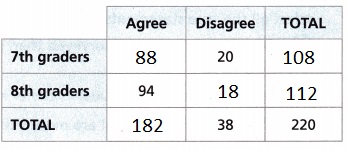
Two hundred twenty students were surveyed about whether a mural should be painted on a wall of the cafeteria. Complete the two-way table showing the results of the survey.
Answer:
Explanation:
Given two hundred twenty students were surveyed about whether a mural should be painted on a wall of the cafeteria. Completed the two-way table showing the results of the survey as shown above.
Question 6.
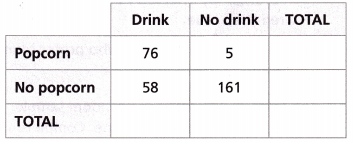
Use Tools Three hundred people at a movie theater were asked whether they bought popcorn or a drink at the theater. How many more people surveyed did NOT buy popcorn than did buy popcorn? State what strategy and tool you will use to answer the question, explain your choice, and then find the answer.
Answer:
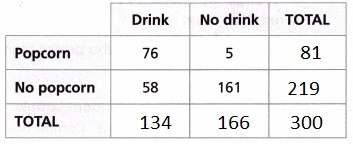
219 people,
Explanation:
Given three hundred people at a movie theater were asked whether they bought popcorn or a drink at the theater. So many more people surveyed did NOT buy popcorn than did buy popcorn is by completeing the table as shown above we get the results as 219 people.
Question 7.
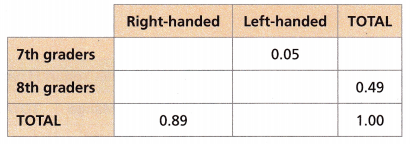
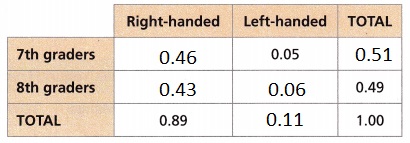
Three hundred students were surveyed about whether they are right- or left-handed. Complete the two-way relative frequency table.
Answer:
Explanation:
Given three hundred students were surveyed about whether they are right- or left-handed.
Completed the two-way relative frequency table above.
Question 8.
Five hundred randomly-selected voters were surveyed about whether they support a new park. The two-way table shows the results of the survey. Which statement is best supported by the survey results?
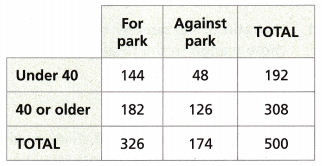
(A) A voter’s age appears to be unrelated to his or her opinion about the park.
(B) Voters aged 40 or older are more likely to be for the park than voters under age 40.
(C) Voters against the park are more likely to be under age 40 than voters for the park.
(D) Voters under age 40 are more likely to be for the park than voters aged 40 or older.
Answer:
(B) Voters aged 40 or older are more likely to be for the park than voters under age 40,
Explanation:
Given Five hundred randomly-selected voters were surveyed about whether they support a new park.
The two-way table shows the results of the survey. The statement is best supported by the survey results is voters aged 40 or older are more likely to be for the park than voters under age 40 because it is 182 the maximum so are more likely thats why bit (B) statement is best supported by the survey results.
Question 9.
A random sample of 200 students at a school were surveyed about whether they prefer red or blue as a new school color. Complete the relative frequency table. Based on the table, select all the true statements.
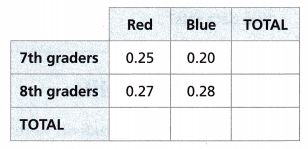
(A) More 8th graders were surveyed than 7th graders.
(B) More of the surveyed students prefer red than prefer blue.
(C) 8th graders at the school are more likely to prefer red than 7th graders are.
(D) A randomly selected 7th grader at the school is more likely to prefer red than blue.
(E) Students at the school who prefer blue are more likely to be in 7th grade than 8th grade.
Answer:
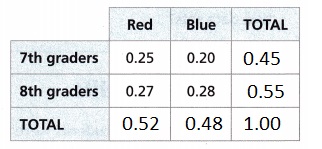
(A) More 8th graders were surveyed than 7th graders,
(B) More of the surveyed students prefer red than prefer blue,
(C) 8th graders at the school are more likely to prefer red than 7th graders are,
(D) A randomly selected 7th grader at the school is more likely to prefer red than blue,
Explanation:
Given a random sample of 200 students at a school were surveyed about whether they prefer red or blue as a new school color. Completed the relative frequency table.
Based on the table, selected all the true statements as (A) More 8th graders were surveyed than 7th graders as 0.55 is greater than 0.45,
(B) More of the surveyed students prefer red than prefer blue as 0.52 > 0.48,
(C) 8th graders at the school are more likely to prefer red than 7th graders are as 0.27 > 0.25 and
(D) A randomly selected 7th grader at the school is more likely to prefer red than blue as 0.25 > 0.20.
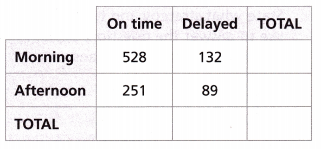
Question 10.
The table shows data for a random sample of flights for a particular airline. Complete the table. Based on the table, what is the conditional relative frequency that a flight will be on time given that it is a morning flight?
Answer:
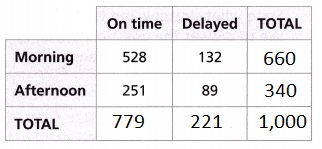
0.68 is the conditional relative frequency that a flight will be on time given that it is a morning flight,
Explanation:
The table showed data for a random sample of flights for a particular airline. Completed the table.
Based on the table, the conditional relative frequency that a flight will be on time given that it is a morning flight is 528 ÷ 779 = 0.677 rounding to hundredth is 0.68.