We included HMH Into Math Grade 8 Answer Key PDF Module 9 Lesson 3 Interpret Two-Way Relative Frequency Tables to make students experts in learning maths.
HMH Into Math Grade 8 Module 9 Lesson 3 Answer Key Interpret Two-Way Relative Frequency Tables
I Can calculate conditional relative frequencies to determine whether there is an association between two variables and compare likelihoods from a table.
Spark Your Learning
Previously, you constructed this relative frequency table about two favorite activities of 200 visitors to Everglades National Park.
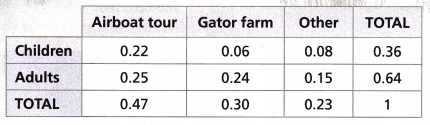
What information can you determine about visitors to the park from the table?
Answer:
Children visited to the park are 36% and Adults visited to the park are 64%,
Explanation:
The information I can determine about the park is children visited to the park are 36% and
Adults visited to the park are 64%.
Turn and Talk How is determining relationships from a relative frequency table similar to and how is it different from determining relationships from a frequency table?
Answer:
A frequency count is a measure of the number of times that an event occurs. The above equation expresses
relative frequency as a proportion. The relative frequency of a class is the percentage of
data that falls into that class, while the cumulative frequency of a class is the sum of the frequencies of that class and all previous classes,
Explanation:
A frequency count is a measure of the number of times that an event occurs. The above equation
expresses relative frequency as a proportion. It is also often expressed as a percentage.
Thus, a relative frequency of 0.50 is equivalent to a percentage of 50%.
Relative frequency represents the ratio of the number of times a value of the data occurs in a dataset,
while cumulative frequency represents the sum of the relative frequencies.
An easy way to define the difference between frequency and relative frequency is that frequency
relies on the actual values of each class in a statistical data set while relative frequency compares these individual values to the overall totals of all classes concerned in a data set.
Build Understanding
Connect to Vocabulary
You can use a two-way relative frequency table to find conditional relative frequencies. A conditional relative frequency is the ratio of a joint relative frequency to a related marginal relative frequency. It is used to find the likelihood of an event assuming another event also occurred.
Question 1.
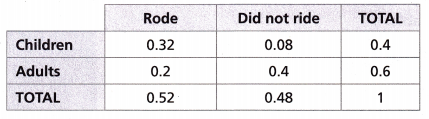
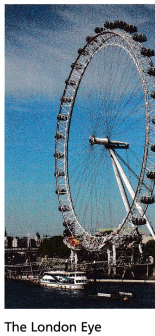
A travel company had 150 London visitors surveyed to find out whether they rode the London Eye, a Ferris wheel in England, during their visit. The company made this table to show the data.
The manager of the travel company wants to know if there is an association between age and whether a visitor rode the London Eye.
A. To determine if there is an association between age and riding the London Eye, first find the overall percentage of visitors who rode the London Eye. Where can you find this information in the table?
Answer:
In Total of Rode 0.52, 52% percentage of visitors rode the London Eye,
Explanation:
To determine if there is an association between age and riding the London Eye, first found the overall
percentage of visitors who rode the London Eye. We can find this information in the table at Total of
rode 0.52. So the percentage of visitors rode the London Eye are 52%.
B. Now find the conditional relative frequency that a surveyed visitor rode the London Eye, given that the visitor is a child. Show how to use values from the table to calculate this, and convert to a percent.
Answer:
It is 0.61, Percentage is 61%,
Explanation:
The conditional relative frequency that a surveyed visitor rode the London Eye, given that the visitor is a child and to use values from the table to calculate this is 0.32/0.52 = 0.61 and percent is 0.61 X 100 = 61%.
C. Compare the percentages you calculated in Parts A and B. Is there an association between age and riding the London Eye? Explain.
Answer:
Yes,
Over all 52% visitors rode London Eye, In that 61% are children,
Explanation:
Comparing the percentages I calculated in Parts A and B. Yes, there an association between
age and riding the London Eye as we calculate the 61 percent of children visitors are from the
overall visitors 52% percent only.
D. Calculate the conditional relative frequency that a surveyed visitor rode the London Eye, given that the visitor is an adult, and convert it to a percent. Do you see the same association between age and riding the London Eye? Explain.
Answer:
0.38, Percentage is 38%, Yes, In over all 52% visitors rode London Eye, 38% are adults,
Explanation:
The conditional relative frequency that a surveyed visitor rode the London Eye that the visitor is an adult are 0.2/0.52 = 0.38 So percentage is 0.38 X 100 = 38%, Yes, there an association between age and riding the London Eye as we calculate the 38 percent of adult visitors are from the
overall visitors 52% percent only.
E. Is it more likely that a surveyed visitor rode the London Eye given that the visitor is an adult, or that a surveyed visitor is an adult given that the visitor rode the London Eye? Explain.
Answer:
Yes, It is more likely that a surveyed visitor rode the London Eye given that the visitor is an adult,
out of 0.52 only 0.2 are adults,
Explanation:
Yes, It ismore likely that a surveyed visitor rode the London Eye given that the visitor is an adult, Because out of 0.52 only 0.2 are adults means 52% visitor rode the London Eye in that only it is 2% are adults, therefore more likely are visitors rode the London Eye.
Step It Out
Question 2.
Heifer A landscaper uses a new fertilizer on some orchid plants, and he keeps track of whether or not the orchid plants produce flowers. The relative frequency table shows the data. The landscaper wants to know if there is an association between an orchid plant receiving the fertilizer and producing flowers.
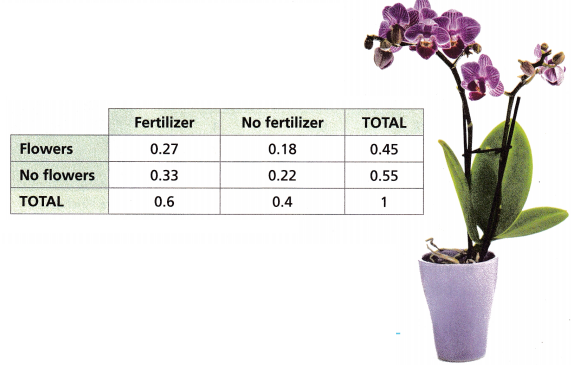
A. What is the marginal relative frequency that an orchid plant produced flowers? What is the marginal relative frequency that an orchid plant received fertilizer?
Answer:
0.45 the marginal relative frequency that an orchid plant produced flowers,
0.6 the marginal relative frequency that an orchid plant received fertilizer,
Explanation:
By seeing the table 0.45 is the marginal relative frequency that an orchid plant produced flowers and
0.6 is the marginal relative frequency that an orchid plant received fertilizer.
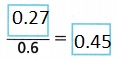
B. What is the conditional relative frequency that an orchid plant produced flowers given that the orchid plant was fertilized?
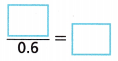
Answer:
 ,
,
Explanation:
The conditional relative frequency that an orchid plant produced flowers given that the
orchid plant was fertilized is 0.27/0.6 = 0.45.
C. Were the orchid plants that received the fertilizer more, less, or equally likely to produce flowers than the overall population?
Answer:
Less likely,
Explanation:
The orchid plants that received the fertilizer are less likely to produce flowers than the overall population as it is only 0.27 out of 1.0. So less likely.
D. Is there an association between an orchid plant receiving the fertilizer and producing flowers?
Answer:
Yes,
Explanation:
There is an association between an orchid plant receiving the fertilizer and producing flowers about 0.27 produce flowers out of 1.0 which receive fertilizer.
E. What is the marginal relative frequency that an orchid plant did not produce flowers? What is the marginal relative frequency that an orchid plant did not receive fertilizer?
Answer:
0.55,
0.22,
Explanation:
0.55 is the marginal relative frequency that an orchid plant did not produce flowers,
0.22 is the marginal relative frequency that an orchid plant did not receive fertilizer.
F. What is the conditional relative frequency that an orchid plant did not produce flowers given that the orchid plant did not receive fertilizer?
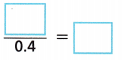
Answer:
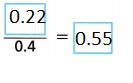
Explanation:
The conditional relative frequency that an orchid plant did not produce flowers given that the orchid plant did not receive fertilizer are 0.22/0.4 = 0.55.
G. Is there an association between an orchid plant not receiving fertilizer and not producing flowers?
Answer:
Yes,
Explanation:
Yes there is an association between an orchid plant not receiving fertilizer and not producing flowers as about 0.22 orchid plants not receive fertilizer and not produce flowers.
Turn and Talk Based on the information in the task, should the landscaper continue to spend the money to fertilize the orchid plants? Why or why not?
Answer:
Yes,
Explanation:
Yes, the landscaper should continue to spend the money to fertilize the orchid plants atleast 0.27 produce flowers after using fertilizers.
Question 3.
The table shows the results of a survey of people who went bird watching. Is there an association between using binoculars and seeing finches?
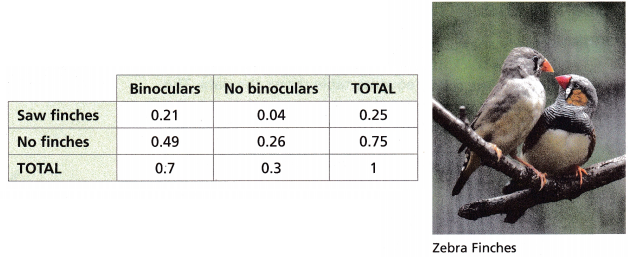
A. What is the marginal relative frequency that a person who was surveyed saw finches?
Answer:
0.25,
Explanation:
About 0.25 is the marginal relative frequency that a person who was surveyed saw finches.
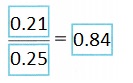
B. What is the conditional relative frequency that a surveyed person saw finches, given the person used binoculars?
Answer:
Explanation:
The conditional relative frequency that a surveyed person saw finches, given the person used binoculars are 0.21 ÷ 0.25 = 0.84.
C. Is there an association between using binoculars and seeing finches?
Answer:
Yes,
Explanation:
Yes, there is an association between using binoculars and seeing finches about 0.21 are associated.
D. What is the marginal relative frequency that a person who was surveyed did not see finches?
Answer:
0.75,
Explanation:
About 0.75 are the marginal relative frequency that a person who was surveyed did not see finches.
E. What is the conditional relative frequency that a surveyed person did not see finches given the person did not use binoculars? Round to the nearest hundredth.
Answer:
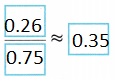
Explanation:
The conditional relative frequency that a surveyed person did not see finches given the person did not use binoculars are 0.26 ÷ 0.75 = 0.34666 rounding to the hundredth is 0.35.
F. Is there an association between not using binoculars and not seeing finches?
Answer:
Yes,
Explanation:
Yes, there is an association between not using binoculars and not seeing finches is about 0.26.
Check Understanding
Question 1.
The relative frequency table shows the results of a survey of hikers as they enter a trail in a state park.
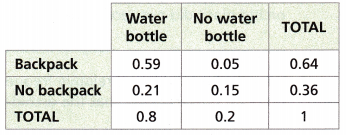
A. Find the conditional relative frequency that a hiker who was surveyed has a backpack, given that the hiker has a water bottle, and convert it to a percent.
Answer:
0.73,
Percentage is 73%,
Explanation:
The conditional relative frequency that a hiker who wa surveyed has a backpack, given that the hiker has a water bottle are 0.59 ÷ 0.8 = 0.73 and percentage is 0.73 X 100 = 73%.
B. Is there an association between having a backpack and having a water bottle? Explain.
Answer:
Yes,
Explanation:
Yes, there is an association between having a backpack and having a water bottle about 0.59
are associated with this.
On Your Own
Use the information to solve Problems 2-4.
Moira grows pumpkins to sell at a farmer’s market. She sorts the pumpkins by color and size and then makes this frequency table to display the data.
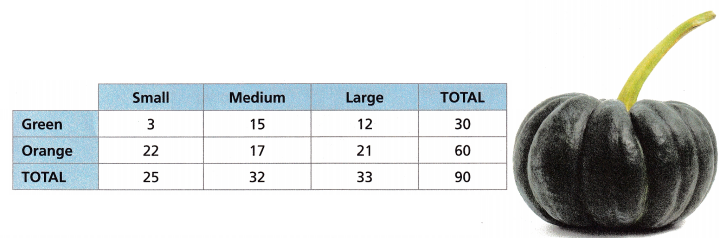
Question 2.
Find the conditional relative frequency that a pumpkin is orange, given that it is a small pumpkin. Express your answer as a fraction, decimal, and percent.
Answer:
Fraction: 22 ÷ 25,
Decimal: 0.88,
Percent: 88%,
Explanation:
The conditional relative frequency that a pumpkin is orange given that it is a small pumpkin. Expressing my answer as a fraction is 22 ÷ 25, decimal is 0.88 and percent is 88%.
Question 3.
Find the conditional relative frequency that a pumpkin is a medium pumpkin, given that it is green. Express your answer as a fraction, decimal, and percent.
Answer:
Fraction: 15 ÷ 32, Decimal: 0.46, Percent: 46%,
Explanation:
The conditional relative frequency that a pumpkin is a medium pumpkin, given that it is green.
Expressing my answer as a fraction is 15 ÷ 32 decimal is 0.46 and percent is 46%.
Question 4.
Is it likely that a pumpkin is a small pumpkin, given that it is green? Use a conditional relative frequency to justify your answer.
Answer:
Yes about 0.12,
Explanation:
Yes, it is likely that a pumpkin is a small pumpkin given that it is green by using a conditional relative frequency it is about 3 ÷ 25 = 0.12.
Question 5.
A restaurant offers a choice of two soups and two sandwiches. The manager keeps track of the orders and makes this relative frequency table.
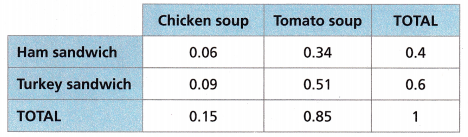
A. What is the conditional relative frequency that a customer orders tomato soup, given that he or she orders a turkey sandwich?
Answer:
0.6,
Explanation:
The conditional relative frequency that a customer orders tomato soup, given that he or she orders a turkey sandwich is 0.51 ÷ 0.85 = 0.6.
B. Construct Arguments Is there an association between the type of sandwich a customer orders and the type of soup he or she orders? Why or why not?
Answer:
Yes,
Arguments:
1. Are Chicken soup and Ham sandwich related,
2. Does Tomato soup and Ham sandwich associated,
3. Do Chicken soup and Turkey sandwich are associated,
4. Is there any relation between Tomato soup and
Turkey sandwich,
Why because all are associated with other and
why not because associated seperately,
Explanation:
Constructed the arguments as 1. Are Chicken soup and Ham sandwich related,
2. Does Tomato soup and Ham sandwich associated,
3. Do Chicken soup and Turkey sandwich are associated,
4. Is there any relation between Tomato soup and
Turkey sandwich,
Yes why because there is an association between the type of sandwich a customer orders and the type of soup he or she orders because all these are associated with one another and why not because
all are associated seperately with soups and sandwiches too.
Question 6.
Critique Reasoning The two-way relative frequency table shows data from a mayoral election. Chris said there is no association between the candidate a person voted for and whether or not a person supports the new ballpark because 55% voted for Chan but 80% support the new ballpark. Do you agree or disagree? Why?
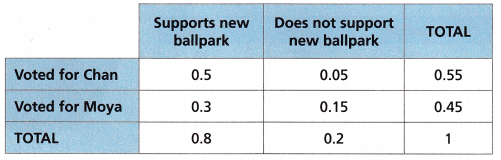
Answer:
I disagree with Chris,
Explanation:
I disagree, because Chris said there is no association between the candidate a person voted for and
whether or not a person supports the new ballpark, as we got 55% votes for Chan through the 80% supports the new ballpark only. Means 55% votes for Chan are only from 80% supports the new ballpark.
Question 7.
Open-Ended The two-way relative frequency table shows data about the sea stars at an aquarium.
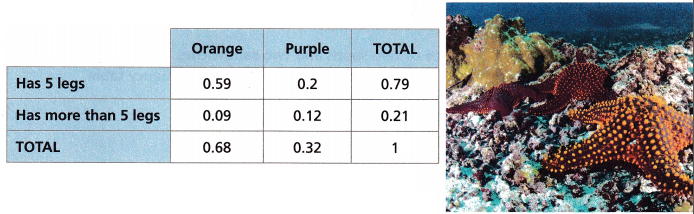
Write a question about the data that can be answered using a conditional relative frequency. Provide the answer to the question.
Answer:
Question:
1. What is the conditional relative frequency that the sea stars are orange and has 5 legs?
answer is 0.86, or
2. What is the conditional relative frequency that the sea stars are purple and has more than 5 legs?
answer is 0.37,
Explanation:
Wrote a question about the data that can be answered using a conditional relative frequency as
1. What is the conditional relative frequency that the sea stars are orange and has 5 legs?
answer is 0.59 ÷ 0.68 = 0.86, or
2. What is the conditional relative frequency that the sea stars are purple and has more tahn 5 legs?
answer is 0.12 ÷ 0.32 = 0.37.
I’m in a Learning Mindset!
How did I collaborate with classmates when solving problems involving conditional relative frequencies?
Answer:
By dividing the frequency by the marginal total,
Explanation:
I collaborate with clasmates when solving problems of conditional relative frequency we compare a frequency count to the marginal total that represents the condition of interest. Example: The row conditional relative frequency of females responding “Invisibility” as the favorite superpower is 48/228 or approximately 0.211.
Here 48 is row frequency and 228 is marginal total.
Lesson 9.3 More Practice/Homework
Question 1.
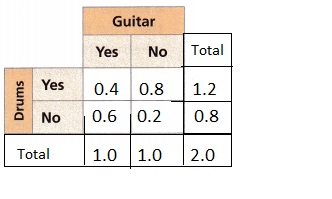
Math on the Spot Ross has been teaching music lessons for three years. The table shows the types of instruments played by his 40 students.
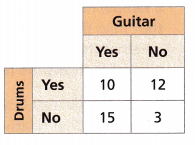
A. Make a table of the joint and marginal relative frequencies.
Answer:
Explanation:
Made a table of the joint and marginal relative frequencies as shown above.
B. What is the conditional relative frequency that a student plays drums given that the student also plays guitar? Express your answer as a decimal and percent.
Answer:
Decimal : 0.4, Pecentage : 40%,
Explanation:
The conditional relative frequency that a student plays drums given that the student also plays guitar is in decimal it is 0.4 ÷ 1.0 = 0.4, In percent it is 0.4 X 100 = 40%.
Question 2.
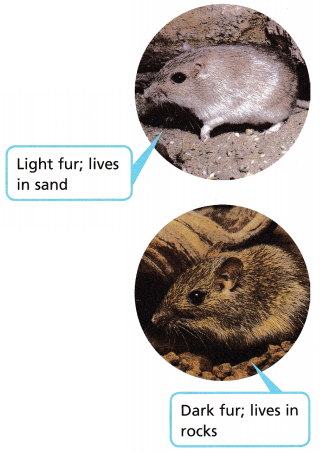
STEM Rock pocket mice live in the deserts of the southwestern United States. The mice have dark fur or light fur depending on the color of the rocks or sand where they live. The relative frequency table shows data about a biologist’s sample of rock pocket mice.
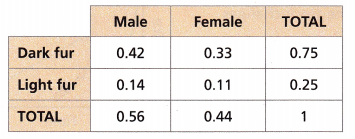
Is there an association between the mouse being male or female and the color of the fur for the sample? Explain.
Answer:
Yes,
Explanation:
Yes, There is an association between the mouse being male or female and the color of the fur for the sample as 0.42 are male with dark fur and 0.33 are female with dark fur also 0.14 are male with light fur and 0.11 are female with light fur so they are associated.
Test Prep
Use the information and table to solve Problems 3-4.
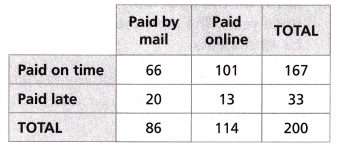
A manager at a gas company collects data on a sample of 200 customers to find out whether they paid their last bill by mail or online and whether they paid late or on time. This two¬way table shows the results.
Question 3.
To the nearest hundredth, what is the conditional relative frequency that a customer paid his or her bill on time, given that he or she paid online?
(A) 0.57
(B) 0.60
(C) 0.84
(D) 0.89
Answer:
(D) 0.89,
Explanation:
To the nearest hundredth, the conditional relative frequency that a customer paid his or her bill on time, given that he or she paid online is 101 ÷ 114 = 0.885 near to 0.89 which matches with (D).
Question 4.
To the nearest hundredth, what is the conditional relative frequency that a customer paid by mail, given that the customer paid late?
(A) 0.23
(B) 0.33
(C) 0.61
(D) 0.86
Answer:
(A) 0.23,
Explanation:
To the nearest hundredth, the conditional relative frequency that a customer paid by mail,
given that the customer paid late is 20 ÷ 86 = 0.232 near to 0.23 which matches with (A).
Question 5.
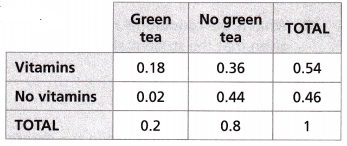
The two-way relative frequency table displays data from a survey of customers at a health food store. Is there an association between taking vitamins and drinking green tea?
Answer:
Yes,
Explanation:
Yes as there is an association between taking vitamins and drinking green tea as 0.18 are associated with it.
Spiral Review
Question 6.
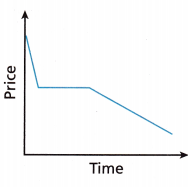
The graph represents the price of a stock during the course of one day. Describe how the price of the stock changes during the day.
Answer:
High, Medium, Low,
Explanation:
During the day by seeing the graph the price of the stock intially is at high and comes to middle and is stable for some time then later as time passes it has become low.
Question 7.
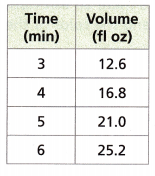
Bucket A is filled with water according to the equation y = 2.5x, where x is the time in minutes and y is the volume in fluid ounces. Bucket B is filled with water according to the data in the table. Which bucket is filled at a faster rate? How do you know?
Answer:
Bucket B,
Explanation:
Given Bucket A is filled with water according to the equation y = 2.5x, where x is the time
in minutes and y is the volume in fluid ounces.
Bucket B is filled with water according to the data in the table. Bucket B is filled with equation y = 4.2x as if x is 3 then y = 12.6/3 = 4.2,if x = 4 then y = 16.8/4 = 4.2, if x = 5 then y = 21/5 = 4.2,
if x = 6 then y = 25.2/6 = 4.2, so the equation for Bucket B is y = 4.2x now upon compairing
Bucket A and Bucket B, Bucket B fills in faster rate as 4.2 is more than 2.5 times.
Question 8.
Solve for x: 4(x + 1.5) = 3x + 9.2
Answer:
x = 3.2,
Explanation:
Solving for x as 4(x + 1.5) = 3x + 9.2, 4x + 6 = 3x + 9.2, 4x – 3x = 9.2 – 6,
x = 3.2, checking left side 4(3.2 + 1.5) = 12.8 + 6.0 = 18.8 and right side 3 X 3.2 + 9.2 =
9.6 + 9.2 = 18.8 as left is equal to right side so x = 3.2.