We included HMH Into Math Grade 8 Answer Key PDF Module 9 Lesson 2 Construct Two-Way Relative Frequency Tables to make students experts in learning maths.
HMH Into Math Grade 8 Module 9 Lesson 2 Answer Key Construct Two-Way Relative Frequency Tables
I Can construct a two-way relative frequency table, complete a relative frequency table given partial data, and interpret joint and marginal relative frequencies.
Spark Your Learning
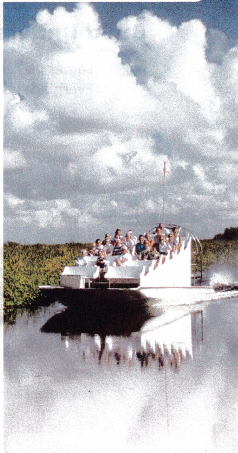
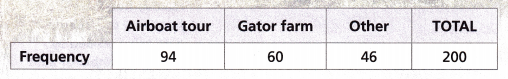
Lamar surveyed 200 people who visited Everglades National Park in Florida. He asked them to name their favorite activity in the park and he made this frequency table to show the results.
Using what you know about proportions and percents, what information can you determine from the table?
Answer:
Portions are 47:60:46, Percentage of Airboat tour is 47%,
Percentage of Gator farm is 30%, Percentage of other is 23%,
Explanation:
Given Lamar surveyed 200 people who visited Everglades,
National Park in Florida. He asked them to name their favorite activity in the park and he made the frequency table to show the results. the portions of Airboat tour : Gator farm : Others is
94:60:46 = 47:60:46, The percentage of Airboat tour is 94/200 X 100 = 47%,
The percentage of Gator farm is 60/200 X 100 = 30% and The percentage of others is 46/200 X 100 = 23%.
Turn and Talk How can you check that you calculated correctly?
Answer:
The total portions are 200, The total percentage is 100%,
Explanation:
I can check that I calculated correclty as the total portions we get 94+ 60 + 46 = 200 which is
same as 200 people were surveyed. The total percentage is 47% + 30% + 23% = 100%.
Build Understanding
Question 1.
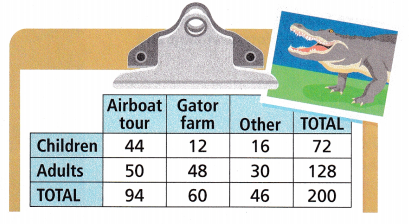
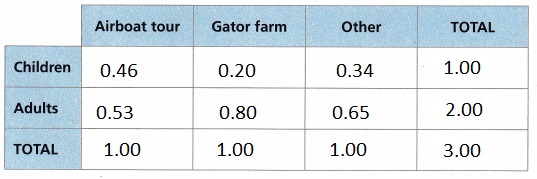
Lamar makes a two-way frequency table by breaking down the Everglades data for children and adults.
A two-way relative frequency table is a two-way table that displays relative frequencies.
Connect to Vocabulary
A frequency is the number of times a data value occurs. A relative frequency is the frequency of a specific data value divided by the total number of data values in the set. It shows how common a data value is, relative to its data set.
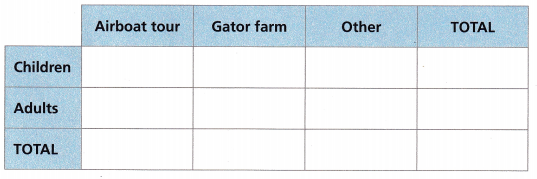
A. Divide each value in the frequency table by the total number of data values. Write each quotient as a decimal, rounding to the nearest hundredth.
Answer:
Explanation:
Divided each value in the frequency table by the total number of data values. Wrote each quotient as
a decimal, rounding to the nearest hundredth.
B. What do you notice about the value in the lowest right cell of the relative frequency table? Why does this number make sense?
Answer:
1, One hundred percent of the data,
Explanation:
I noticed the value in the lowest right cell of the relative frequency table as 1,
Indicating that one hundred percent of the data has been accumulated.
C. Why might it be useful to fill the two-way table with relative frequencies rather than absolute frequencies?
Answer:
Relative frequency compares individual values to the overall totals of all classes concerned in a data set. Relative frequencies are usually expressed as ratios, rates, proportions or percentages.
Absolute frequencies are usually expressed as whole numbers.
Explanation:
A relative frequency is the number of times a particular value of a variable is observed relative
to the total number of observed values of that variable.
The absolute frequency is the number of times a particular value (or particular set of values) of a
variable is observed. For example, in a coin tossing exercise after 10 tosses we have 6 heads and 4 tails (the absolute frequencies). The ratio of heads to tails is 6:4. Alternatively, the proportion of tosses
resulting in heads is .6 and resulting in tails is .4.
Step It Out
Question 2.
The table you constructed in the previous task is useful for determining various relative frequencies.

A joint relative frequency is the frequency in a particular category divided by the total number of data values.
A. Identify the joint relative frequency of children whose favorite activity was the airboat tour in the table you constructed in the previous task. A marginal relative frequency is the sum of the joint relative frequencies in a row or column of a two-way table.
Answer:
1.00,
Explanation:
The joint relative frequency of children whose favorite activity was the airboat tour in the table
I constructed in the previous task is 1.00.
B. The marginal relative frequency of children in the table is ___________.
Answer:
1.00,
Explanation:
The marginal relative frequency of children in the table is 1.00.
C. Add the joint relative frequencies in each row and in each column. What do you notice?
“Children” row: ___________ + ___________ + ___________ = ___________
“Adult” row: __________ + ___________ + ___________ = ___________
“Airboat tour” column: ___________ + ___________ = ___________
“Gator farm” column: ___________ + ___________ = ___________
“Other” column: ___________+ ___________ = ___________
The sum of the ___________ frequencies in a row or column equals the ___________ frequency.
Answer:
“Children” row: 1.00,
“Adult row” : 2.00,
“Airboat tour” column: 1.00,
“Gator farm” column: 1.00,
“Other” column:1.00,
The sum of the relative frequencies in a row or column equals the joint relative frequencies,
Explanation:
Adding the joint relative frequencies in each row and in each column”C hildren” row: 0.46 + 0.20 + 0.34 = 1.00, “Adult row” : 0.53 + 0.8 + 0.65 = 2.00, “Airboat tour” column: 0.46 + 0.53 = 1.00, “Gator farm” column: 0.2 + 0.8 = 1.00, “Other” column:0.34 + 0.65 = 1.00, The sum of the relative frequencies in a row or column equals the joint relative frequencies.
D. What percentage of visitors were children?
Answer:
36%,
Explanation:
The percentage of visitors were children are 72/200 X 100 = 36%.
E. What percentage of visitors were children whose favorite activity was the airboat tour?
Answer:
61%,
Explanation:
The percentage of visitors were children whose
favorite activity was the airboat tour is 44/72 X 100 =
Turn and Talk What do the marginal relative frequencies for the columns represent? Explain your reasoning.
Answer:
Joint relative frequencies in a column,
Explanation:
Marginal relative frequency for the columns represent the sum of the joint relative frequencies
in a column.
Question 3.
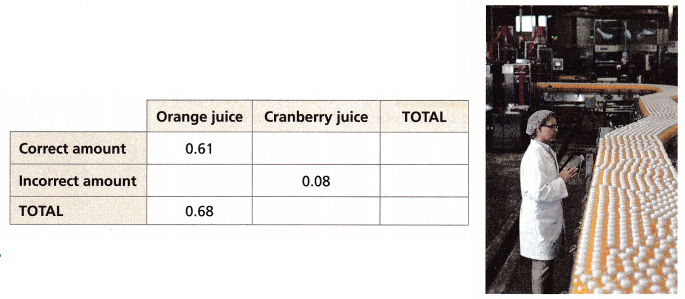
A factory produces bottles of orange juice and bottles of cranberry juice. A quality control manager selects a random sample of bottles and checks that they contain the correct amount of juice.
A. Use an equation to find the missing value in the first column.
0.61 + x = 0.68
x = ___________
Answer:
x = 0.07,
Explanation:
Used the eqaution 0.61 + x = 0.68 to find the missing value in the first column as
x = 0.68 – 0.61 = 0.07.
B. What value goes in the bottom right cell of the table?
Answer:
1.00,
Explanation:
The value that goes in the bottom right cell of the
table is 1.00.
C. Use an equation to find the missing value in the TOTAL row. 0.68 + y = ____________
y = _____________
Answer:
0.68 + y = 1.00,
y = 0.32,
Explanation:
An equation to find the missing value in the TOTAL row is 0.68 + y = 1.00, so y = 1.00 – 0.68,
y = 0.32,
D. Use an equation to find the missing value in the middle column.
z + 0.08 = _____________
z = _____________
Answer:
z + 0.08 = 0.15, z = 0.07,
Explanation:
An equation to find the missing value in the middle column is
z + 0.08 = 0.15, z = 0.15 – 0.08, z = 0.07.
E. Add to find the missing values in the TOTAL column.
0.61 + _____________ = _____________
_____________ + 0.08 = _____________
Answer:
0.61 + 0.24 = 0.85, 0.07 + 0.08 = 0.15,
Explanation:
Adding to find the missing values in the TOTAL column as 0.61 + 0.24 = 0.85,
0.07 + 0.08 = 0.15.
F. Fill in the missing values in the table.
Answer:
Explanation:
Filled the missing values in the table as shown above.
G. Is it possible to know how many bottles of juice the quality control manager checked? Explain.
Answer:
Yes, 100 bottles of juice the quality control manager checked,
Explanation:
The data given is relative frequencies which is percentage or ratios of Orange juices and
Cranberry juices by seeing the Total of 0.68 and 0.32 we can say the total we got 1.00 means 100
bottles of juice the quality control manager checked.
Check Understanding
Question 1.
The table shows the results of a survey of student bike-riding habits.
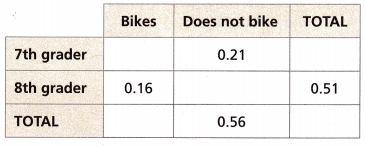
A. Complete the two-way relative frequency table.
Answer:
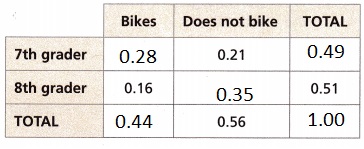
Explanation:
Completed the two-way relative frequency table as shown above.
B. List the joint relative frequencies.
Answer:
0.28, 0.16, 0.21 and 0.35,
Explanation:
Joint relative frequency is the ratio of a frequency that is not in the total row or the total column to
the total number of values or observations. Marginal frequency is the entry in the “total”
for the column and the “total” for the row in two-way frequency table.
So 0.28, 0.16, 0.21 and 0.35.
C. List the marginal relative frequencies.
Answer:
0.44, 0.56, 0.49 and 0.51,
Explanation:
Marginal relative frequency is the ratio of the sum of the joint relative frequency in a
row or column and the total number of data values. So 0.44, 0.56, 0.49 and 0.51.
On Your Own
Question 2.
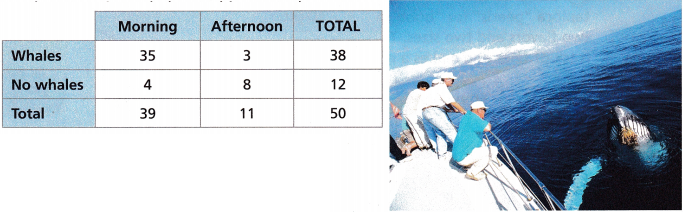
A company that organizes whale watching tours keeps track of the time of day the boats leave and whether or not any whales were spotted. A frequency table is made to show the results.
A. Attend to Precision Convert the table to show the relative frequencies.
Answer:
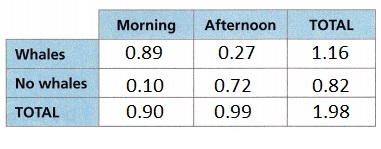
Explanation:
Converted the table to show the relative frequencies as shown above.
B. What is the joint relative frequency of morning trips that saw whales? What percentage of morning trips spotted whales?
Answer:
0.89,0.10,0.27,0.72, 89% of morning trips spotted whales,
Explanation:
The joint relative frequency of morning trips that saw whales are 0.89,0.10,0.27,0.72, The percentage of morning trips spotted whales are 35/39 X 100 = 89%.
C. What is the marginal relative frequency of not seeing whales? What percentage of trips did not see whales?
Answer:
0.82, 24% of trips did not see whales,
Explanation:
0.82 is the marginal relative frequency of not seeing whales.
The percentage of trips did not see whales are 12/50 X 100 = 24%.
Question 3.
Carolina checks CDs and DVDs when they are returned to the public library. She keeps track of whether or not the items are damaged. The two-way relative frequency table shows her findings.
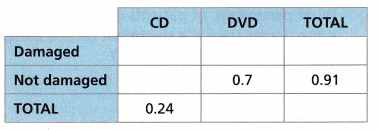
A. Complete the two-way relative frequency table.
Answer:
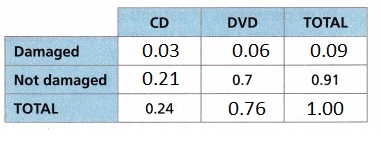
Explanation:
Completed the two-way relative frequency table as shown above.
B. What is the marginal relative frequency of CDs returned?
Answer:
0.24,
Explanation:
The marginal relative frequency of CDs returned is 0.24.
C. What is the marginal relative frequency of DVDs returned?
Answer:
0.76,
Explanation:
The marginal relative frequency of DVDs returned is 0.76.
D. Reason What is the relationship between these two numbers? Why?
Answer:
When both are added we get value as 100 percent,
Explanation:
When we add the marginal relative frequency of CDs returned and DVDs returned 0.24 + 0.76 = 1.00, which means 100 percent.
Use the information for Problems 4-5.
Use Structure Boba tea is a drink made from tea and tapioca “pearls” (or “bubbles”). A boba tea shop offers two flavors and two sizes. The owner of the shop keeps track of sales and makes a relative frequency table.
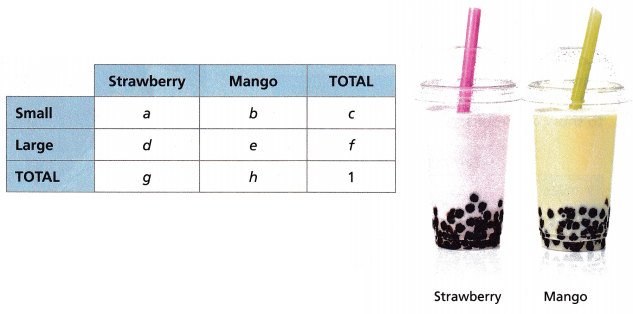
Question 4.
Write an equation that relates the quantities a, b, and c.
Answer:
a + b = c,
Explanation:
The equation that relates the quantities a,b and c is a + b = c.
Question 5.
Write an equation solved for c in terms of f.
Answer:
c = 1 – f,
Explanation:
An eqaution solved for c in terms of f is c = 1 – f.
Question 6.
STEM A doctor participated in a study of a new allergy treatment. The doctor kept track of whether or not her patients got a rash or a headache as a side effect of the treatment. The two-way relative frequency table shows the results.
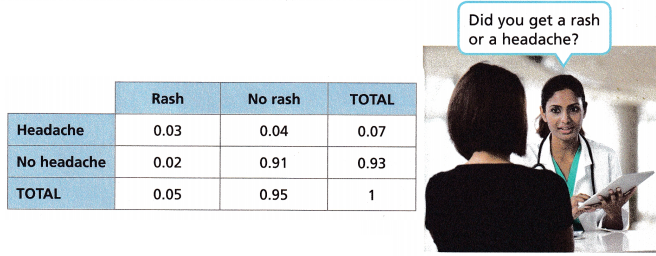
What percentage of patients got a headache but not a rash? If the doctor tried the treatment on 300 patients, how many got a headache but not a rash?
Answer:
4% percentage of patients got a headache but not a rash, 12 patients got a headache but not a rash,
Explanation:
Given a doctor participated in a study of a new allergy treatment. The doctor kept track of
whether or not her patients got a rash or a headache as a side effect of the treatment.
The two-way relative frequency table showed the results.
The percentage of patients got a headache but not a rash are 0.04/0.95 X 100 = 4%,
If the doctor tried the treatment on 300 patients, Number of got a headache but not a rash are
4/100 X 300 = 12 patients.
I’m in a Learning Mindset!
What was challenging about determining how many patients got a headache but not a rash in Problem 6?
Answer:
Calculate for 300 patients not for 100 patients,
Explanation:
The challenging about determining how many patients got a headache but not a rash in Problem 6 is we need to calculate for 300 patients not for 100 patients.
Lesson 9.2 More Practice/Homework
Question 1.
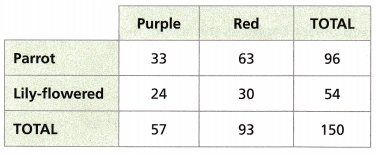
Reason A nursery sells bulbs for purple tulips and red tulips. The tulips are available as parrot tulips, with a feathery edge, or lily-flowered tulips, with pointed petals.

The table shows the numbers of bulbs sold during one week.
A. Construct a two-way relative frequency table for the data.
Answer:
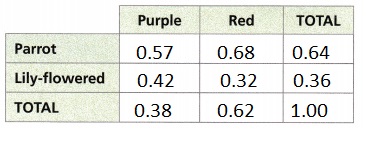
Explanation:
Constructed a two-way relative frequency table for the data given as shown above.
B. What percentage of the bulbs were purple? What value tells you this?
Answer:
38% percentage of the bulbs were purple, 0.38 tells us about the bulbs were purple,
Explanation:
The percentage of the bulbs were purple are 57/150 X 100 = 38%, The value 0.38 in the
Total Purple column tell us this.
C. What percentage of the bulbs were red with feathery edges? What value in the table gives you this information?
Answer:
68% percentage of the bulbs were red with feathery edges, 0.68 in Red Parrot row column
tells us about this,
Explanation:
The percentage of the bulbs were red with feathery edges are 63/93 X 100 = 68%,
The value 0.68 in Red Parrot column or row in the table gives us this information.
Question 2.
STEM An optometrist surveys some patients to find out whether they mostly wear glasses or contacts and whether or not they sometimes need eye drops during the day to help with dry eyes. The optometrist records the data in a table. Complete the table.
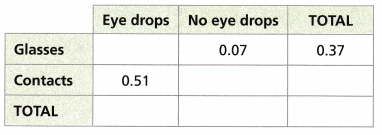
Answer:
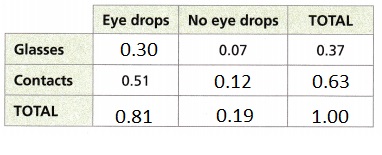
Explanation:
Given an optometrist surveys some patients to find out whether they mostly wear glasses or
contacts and whether or not they sometimes need eye drops during the day to help with dry eyes.
The optometrist recorded the data in a table. Completed the table as shown.
Test Prep
Use the information and table to solve Problems 3-4.
The students at Harriet Tubman Middle School are choosing a new school mascot and new school color. This relative frequency table shows the results.
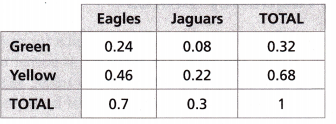
Question 3.
What percentage of students surveyed prefer Eagles as the school mascot?
(A) 7%
(B) 24%
(C) 46%
(D) 70%
Answer:
(D) 70%,
Explanation:
The percentage of students surveyed prefer Eagles as the school mascot is 0.7 X 100 = 70%,
which matches with (D).
Question 4.
What is the marginal relative frequency of students who prefer Jaguars as the school mascot?
(A) 0.22
(B) 0.3
(C) 0.32
(D) 0.7
Answer:
(B) 0.3,
Explanation:
The marginal relative frequency of students who prefer Jaguars as the school mascot as it shows 0.3,
so it is 0.3 which matches with (B).
Question 5.
The relative frequency table shows preferences of customers at a breakfast buffet, but some values are missing. Complete the table.
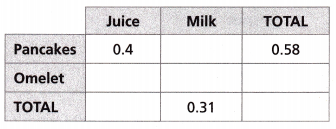
Answer:
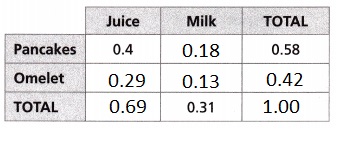
Explanation:
Given the relative frequency table that shows preferences of customers at a breakfast buffet,
but some values are missing. So completed the table as shown above.
Spiral Review
Use the system of equations to solve Problems 6-7.
2x + y = -2
x – y = -4
Question 6.
Describe the main steps for solving the system by substitution.
Answer:
x = y – 4,
Explanation:
The main steps for solving the 2x + y = -2, x – y = -4 system by substitution as x = y – 4.
Question 7.
Solve the system and explain how to check your answer.
Answer:
x = -2 and y = 2, By substituting values of x and y in 2x + y = -2,
we get -2 = -2,
Explanation:
Solving the system as subtituting x = y – 4 in
2(y – 4) + y = -2, 2y – 8 + y = -2, 3y – 8 = -2, 3y = -2 + 8 = 6, 3y = 6,
y = 6/3 = 2, x = 2 – 4 = -2, To check answers substituiting x and y in 2x + y = -2,
2(-2) + 2 = -2, -4 + 2 = -2, – 2 = -2 so values of x = -2 and y = 2.
Question 8.Does the scatter plot show any association? If so, describe the association. If not, explain why not.
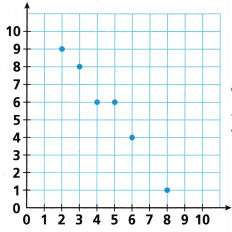
Answer:
Yes,
As one variable x is increasing and the other variable y is decreasing,
there is said to be a negative association,
Explanation:
The scatter plot shows an association as we have points as (2,9), (3,8), (4,6), (5,6) ,(6,4) and (8,1) here
x is increasing and y is decreasing means we will have a negative association.