We included HMH Into Math Grade 8 Answer Key PDF Module 8 Lesson 3 Interpret Linear Data in Context to make students experts in learning maths.
HMH Into Math Grade 8 Module 8 Lesson 3 Answer Key Interpret Linear Data in Context
I Can use the equation of a line to solve problems in the context of bivariate measurement data, interpreting the slope and intercept.
Step It Out
Question 1.
Janelle is making a graph that compares the salaries and ages of the members of the planning department. She lists the salaries by tens of thousands of dollars and the ages by years.
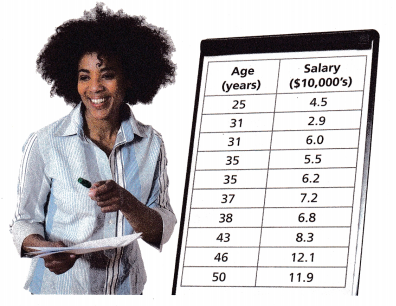
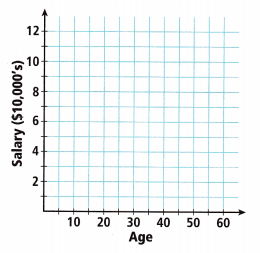
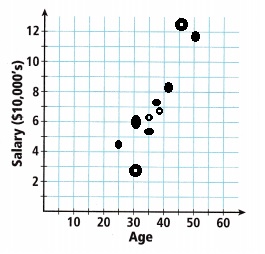
A. Use the graph provided to make a scatter plot using the data in the table.
Answer:
Explanation:
Used the graph provided to make a scatter plot using the data in the table as shown above.
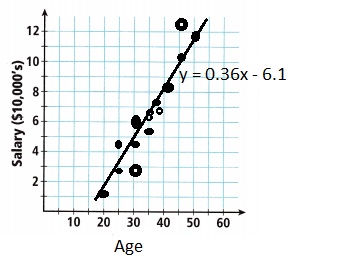
B. The line y = 0.36x – 6.1 is a trend line for the scatter plot. Add the trend line to the graph.
Answer:
Explanation:
Given the line y = 0.36x – 6.1, If x = 10, y = 0.36 X 10 – 6.1 = -2.5,
If x = 20, y = 0.36 X 20 – 6.1 = 1.1, If x = 25, y = 0.36 X 25 – 6.1 = 2.9,
If x = 30, y = 0.36 X 30 – 6.1 = 4.7, If x = 35, y = 0.36 X 35 – 6.1 = 6.5,
If x = 40, y = 0.36 X 40 – 6.1 = 8.3, If x = 45, y = 0.36 X 45 – 6.1 = 10.1,
If x = 50, y = 0.36 X 50 – 6.1 = 11.9 added the trend line to the graph above.
C. Complete the interpretation of the slope of the trend line.
The slope is ___________. This means that for every 1 year increase in age, there is a salary increase of ___________ of $10,000. For every one year increase in age, there is a salary increase of $___________.
Answer:
The slope is 0.36.
This means that for every 1 year increase in age,
there is a salary increase of 0.36 of $10,000.
For every one year increase in age,
there is a salary increase of $3,600,
Explanation:
The slope is let us take (45,10.1) and (50,11.9), So (11.9 – 10.1) = m (50 – 45),
1.8 = 5m, m = 1.8/5 = 0.36,
This means that for every 1 year increase in age there is a salary increase of 0.36 of $10,000.
For every one year increase in age there is a salary increase of 0.36 X $10,000 = $3,600.
Turn and Talk Does every older worker make more money than any particular younger worker? Explain.
Answer:
Yes,
Explanation:
Yes every older worker make more money than any particular younger worker as if we see as the data
as age is increasing there is rise in salaries.
Question 2.
Hampton wanted to see whether there was an association between the average time people in his class spent exercising per day and the average time they spent sleeping each night. His scatter plot and the equation of his trend line are shown.
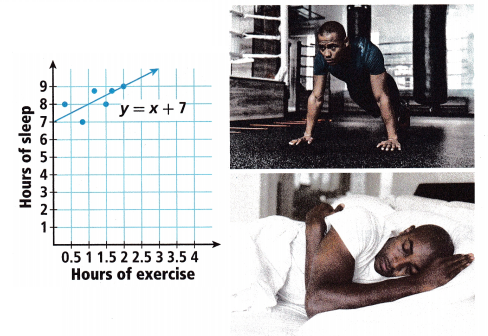
A. How much does the person who exercises 2 hours per day sleep? What does the trend line suggest as the amount of sleeping time for a typical person who exercises 2 hours per day?
Answer:
9 hours,
It is maximum,
Explanation:
The person who exercises 2 hours per day sleep 9 hours, The trend line suggest it is maximum number of hours the amount of sleeping time for a typical perso who exercises 2 hours per day.
B. According to the trend line, about how many hours of sleep would someone who exercises about 1 hour per day get?
Answer:
About 7 hours,
Explanation:
According to the trend line, about 7 hours of sleep would someone who exercises about 1 hour per day gets.
C. According to the trend line, what change in sleep time is associated with each increase of 1 hour of exercise?
Answer:
Almost 1 hour more increases in sleep time,
Explanation:
According to the trend line,There is a change of almost 1 hour sleep time more associated with
each increase of 1 hour of exercise.
D. According to the trend line, about how long might you sleep if you exercised 3 hours per day?
Answer:
10 hours,
Explanation:
According to the trend line, if I exercised 3 hours per day long might I sleep is
y = 3 + 7 = 10 hours.
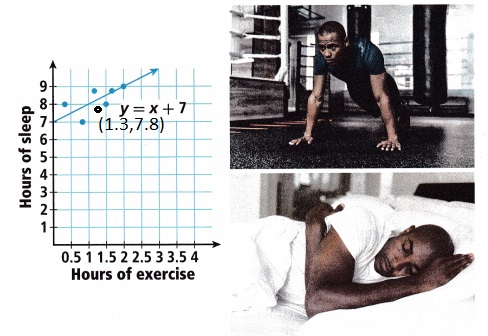
E. What would the data point (1.3, 7.8) mean on this graph? Is it on the trend line?
Answer:
Explanation:
The data point (1.3, 7.8) mean on this graph as it is not on the trend line and is below the trend line, So for 1.3 hours of exercise 7.8 is not sufficient hours of sleep.
F. The coordinates of the initial value are ____________.
A person who doesn’t exercise at all sleeps about ___________ hours per night.
Answer:
The coordinates of the initial value are (0.4,8), A person who doesn’t exercise at all sleeps
about 7 hours per night,
Explanation:
The coordinates of the initial value are (0.4,8), A person who doesn’t exercise at all sleeps
about if x= 0 is y = 0 + 7 = 7 hours per night.
Question 3.
An educator decided to investigate the relationship between the amount of time a group of students spent reading and the amount of time they spent watching television in one week. She graphed her results as shown.
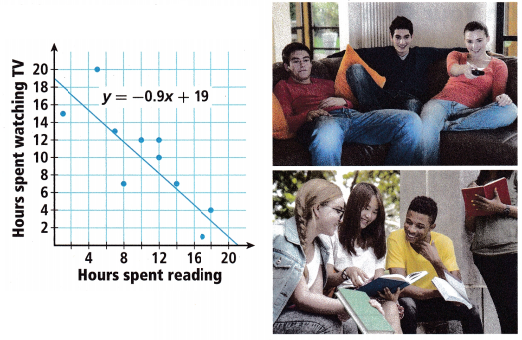
A person reads about 4 hours per week. If he or she also watched television about 4 hours per week, would you consider that data point to be an outlier? Explain.
Answer:
No,
Explanation:
No the data point will not be an outlier as if a person reads about 4 hours per week then
it is if x = 4 then y will be -0.9 X 4 + 19 = – 3.6 + 19 = 15.4 so it is (4, 15.4) the point lies near the
trend line so it is not an outlier.
Turn and Talk Why might predictions made from a trend line not always be accurate?
Answer:
While making a trend line we may try to have minimal distance from each point while trying to
pass through as many points as possible to make it accurate as a trend line is predicted,
Explanation:
Determining the exact value of a trend line may not always be possible because it is predicted.
In some cases an approximation is sufficient for gleaning the general behavior of the data. If the data set is linear, the trend line is simply a line running through each point.
For all other data sets, there is a simple strategy for approximating the trend line: drawing a line that is situated at a minimal distance from each point while trying to pass through as many as possible, so that the number of points falling above and below the line is roughly equal.
Check Understanding
Question 1.
For the graph in Task 3, what does the trend line show?
Answer:
Linear but negative,
Explanation:
As the slope is negative then there is a negative linear relationship, i.e., as hours
spent on reading increased the other variable hours spent watching tv decreased,
Therefore the trend line shows negative linearship.
Question 2.
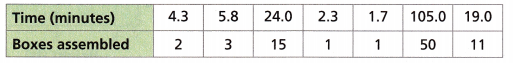
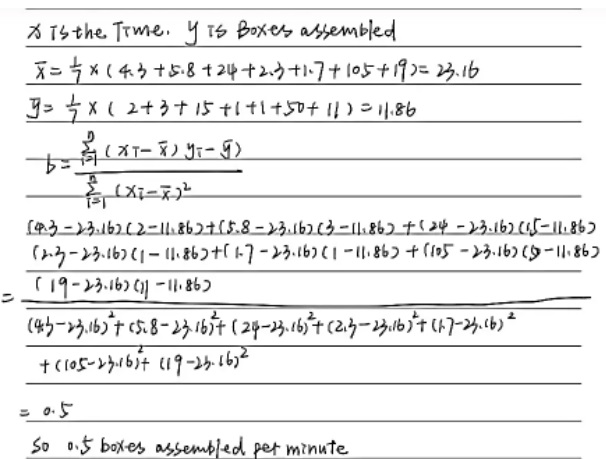
For the data set given in the table, estimate the rate of change of a trend line with good fit.
Answer:
0.5 boxes assembled per minute,
Explanation:
On Your Own
Question 3.
Health and Fitness The coach of a basketball team compared the heights of the players and their average numbers of rebounds per game.
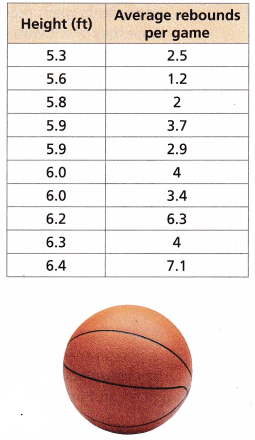
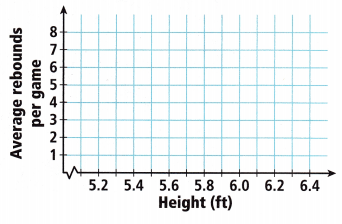
A. Graph the data and the trend line, y = 4.4x – 22.
Answer:
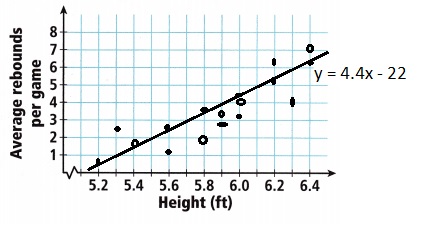
Explanation:
If x = 5.2, y = 4.4 X 5.2 – 22 = 0.88,
If x = 5.4, y = 4.4 X 5.4 – 22 = 1.76,
If x = 5.6, y = 4.4 X 5.6 – 22 = 2.64,
If x = 5.8, y = 4.4 X 5.8 – 22 = 3.52,
If x = 6.0, y = 4.4 X 6.0 – 22 = 4.4,
If x = 6.2, y = 4.4 X 6.2 – 22 = 5.28,
If x = 6.4, y = 4.4 X 6.4 – 22 = 6.16,
Graphed the data and the trend line,
y = 4.4x – 22 as shown above.
B. What is the y-intercept of the trend line?
Answer:
Y-intercept is -22
Explanation:
The y-intercept of the trend line is the point at which the trend line has an x value of zero.
Examine the trend line that is on the graph. To find y-intercept: set x = 0 and solve for y.
So y = 4.4 X 0 – 22, y = 0 – 22, y = -22.
C. What does the y-intercept mean in this situation? Is it useful? Explain.
Answer:
Negative y-intercept means that the line crosses below the origin, No not useful,
Explanation:
For the intercept, negative refers to an interception below the zero point.For the correlation, negative
refers to the slope of the line (going down as we move from left to right). Negative y-intercept is of no practical predictive value. No human can have zero height or a negative weight.
D. The scatter plot shows that as players get taller they tend to get more rebounds. Does that mean that the tallest player would get the most rebounds?
Answer:
Yes,
Explanation:
Given the scatter plot shows that as players get taller they tend to get more rebounds. Yes that means that the tallest player would get the most rebounds as (6.4,7.1).
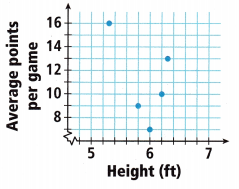
E. The coach also made this scatter plot of the average number of points made by the five top-scoring players, compared to their heights. Compare the general trends from each scatter plot.
Answer:
As compaired the height increases the average number of points made is almost increased,
Explanation:
Given the coach also made this scatter plot of the average number of points made by the five top-scoring players, compared to their heights. Comparing the general trends from each scatter plot as (5.3,16),(5.8,9), (6,6),(6.2,10),(6.3,11), if we see as height increased from 5.3 to 6.3 the average numbers of points made also almost increased.
Use the information to answer Problems 4-6.
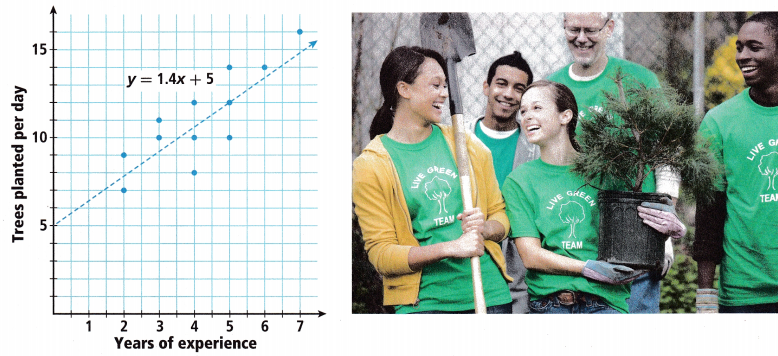
The scatter plot shows how many trees different people who volunteer at the park can plant in a day, as compared with their years of experience planting trees. The equation for the trend line is also included.
Question 4.
A. What does the y-intercept of the trend line show?
Answer:
y = 5, In 0 years we can plant 5 trees in a day,
Explanation:
The y-intercept of the trend line is the point at which the trend line has an x value of zero.
Examine the trend line that is on the graph. To find y-intercept: set x = 0 and solve for y.
So y = 1.4x + 5 = 1.4 X 0 + 5, y = 0 + 5, y = 5. The y-intercept tell us in 0 years we can plant 5 trees in a day.
B. How might a person who is planning a tree-planting event use the y-intercept?
Answer:
In a day a person can plant minimum 5 trees,
Explanation:
A person who is planning a tree-planting event can use the y-intercept as in a day a person can
plant minimum 5 trees.
Question 5.
What does the trend line suggest about the association between experience and tree-planting ability?
Answer:
Association is strong and positive,
Explanation:
The trend line suggest about the association between experience and tree-planting ability as years of experience increases the tree planted per day also increased so the association is strong and positive.
Question 6.
Reason Would an outlier change the trend line? Explain.
Answer:
Sometimes few outliers can change the trendline,
Explanation:
Numerically and graphically, we have identified the point as an outlier. We should re-examine the data for this point to see if there are any problems with the data.
If there is an error, we should fix the error if possible or delete the data. If the data is correct, we would leave it in the data set. We will suppose that we examined the data and found that this outlier data was an error.
Therefore we will continue on and delete the outlier. If we take (4,7) it is an outlier compaired to (4,10.6) on trend line. It will not change the trendline.
Use the information to answer Problems 7-8.
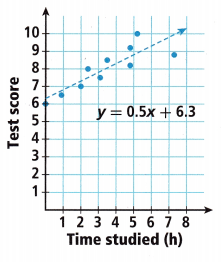
Mr. Peabody asked his class to keep track of how many hours they spent studying for the midterm math exam. Then he made the scatter plot shown. A 10 was the best a person could do on the test.
Question 7.
Critique Reasoning Mr. Peabody said the scatter plot and trend line show that people who studied more got higher scores on the test. Would you agree? Explain.
Answer:
Yes I agree,
Explanation:
Given Mr. Peabody said the scatter plot and trend line show that people who studied more got higher scores on the test. Yes I agree as the scatter plot is positive and trend line is also positive linear, strong associated as the number of hours studied increased there is also increase in test score.
Question 8.
According to the equation of the trend line, each additional hour spent studying raises test scores by how much? How do you know?

Answer:
Test score raises by 0.5,
Through the equation y = 0.5x + 6.3,
Explanation:
According to the equation y = 0.5x + 6.3 of the
trend line each additional hour spent studying
raises test scores by if x = 1 then y = 0.5 X 1+ 6.3 =
0.5 + 6.3 = 6.8, If x = 2 then y = 0.5 X 2 + 6.3 = 1 + 6.3 = 7.3,
If x = 3 then y = 0.5 X 3 + 6.3 = 1.5 + 6.3 = 7.8 and so on
so increase in test score is 0.5. If we see the equation in it
6.3 remains constant as time spend in hours x increases there is
0.5 increase in the test scores y, So raise is 0.5.
Question 9.
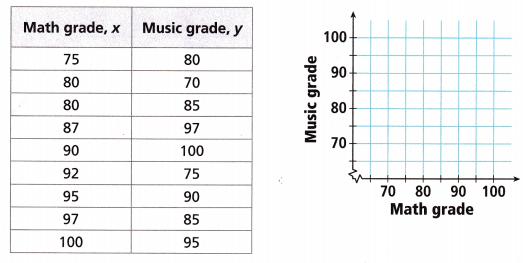
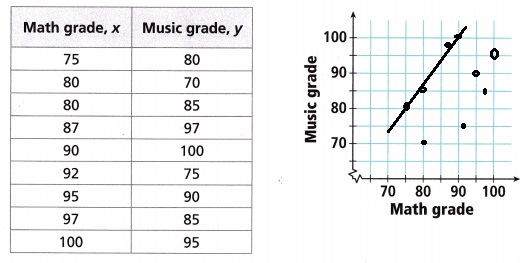
Model with Mathematics Mr. Peabody wanted to see if there was a relationship between students’ grades in math and in music. Nine of his students who studied both math and music agreed to share their grades in each subject.
A. Make a scatter plot of the data. Draw a trend line.
Answer:
Explanation:
Made a scatter plot of the data. Drawn a trend line
as shown above.
B. How would you describe the association, if any? Explain.
Answer:
Association is strong, Linear,
Explanation:
The association is strong and linear as math
grade x increased, music grade y also increased
and the trend line is straight so it is linear.
Lesson 8.3 More Practice/Homework
Question 1.
Construct Arguments A group of people aged 15 to 30 were asked to rate a movie they had just seen from 1 to 5 stars. The managers of the theater looked at the scatter plot of the data to see what they could learn about the movie. The provided trend line is y = –\(\frac{x}{8}\) + 6\(\frac{1}{8}\).
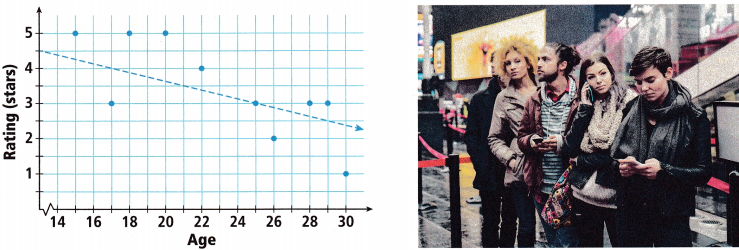
What does the direction of the trend line tell you about the popularity of the movie with older audiences? Explain.
Answer:
Trend line is negative,
Older audiences rated low or less popular,
Explanation:
Given a group of people aged 15 to 30 were asked to
rate a movie they had just seen from 1 to 5 stars.
The managers of the theater looked at the scatter
plot of the data to see what they could learn about the movie.
The provided trend line is y = –\(\frac{x}{8}\) + 6\(\frac{1}{8}\).
The direction of the trend line tells us about the
popularity of the movie with older audiences as it is
decreasing and negative older audiences rated it as low or
less popular.
Question 2.
A sports watch company conducted a trial of its new watch with eight people. The watches tracked the distance each person walked per day.
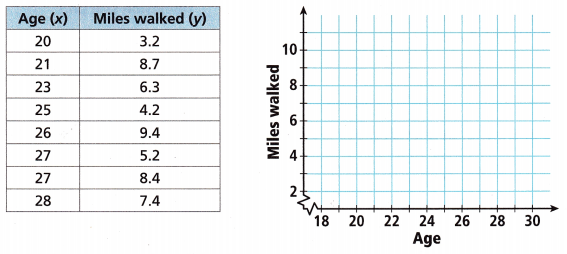
A. Make a scatter plot of the data.
Answer:
Explanation:
Made a scatter plot of the data as shown.
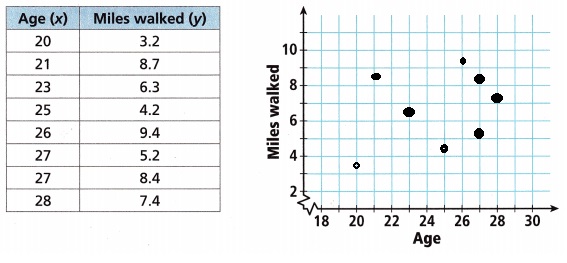
B. Open-Ended What type of association between the variables does the scatter plot show? Can you draw a good trend line? If so, give its equation.
Answer:
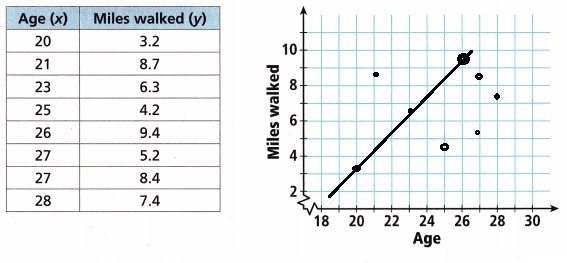
Yes, can draw a good trend line,
Equation : y = 1.033x – 17.46,
Explanation:
Linear positive association as age increases miles walked also has increased so association is
positive. yes can draw a good trend line the equation would be as the points are (20,3.2),
(23,6.3), slope m = y2 – y1 / x2 – x1 = 6.3 – 3.2 / 23 – 20 = 3.1/3 = 1.033, Now constant y intercept is
y = mx + b so lets take point (20,3.2), 3.2 = 1.033 X 20 + b, b = 3.2 – 20.66 = – 17.46,
So the equation is y = 1.033x – 17.46.
Test Prep
Question 3.
Diners were surveyed after eating at a restaurant. Their ages were associated with their rating of the food. A good trend line for the scatter plot was y = 0.002x + 4. What does the slope tell you about the scatter plot?
(A) No one liked the food.
(B) The rating changed quickly depending on age.
(C) Both young and old diners liked the food about the same.
(D) The younger the diner, the better chance they liked the food.
Answer:
(B) The rating changed quickly depending on age and
(D) The younger the diner, the better chance they liked the food,
Explanation:
Given Diners were surveyed after eating at a restaurant.
Their ages were associated with their rating of the food.
A good trend line for the scatter plot was y = 0.002x + 4.
The slope tell us about the scatter plot as it is 0.002 means
m is 2/1,000 means y2 – y1/x2 – x1 is 2/1,000 that means
as age is differing there is lot of change in liking the food,
So it means (B) The rating changed quickly depending on age and
(D) The younger the diner, the better chance they liked the food.
Question 4.
A scatter plot is made comparing x, the number of hours since midnight, with y, the number of lights turned on in a house. What would a point at (7, 8) on the scatter plot mean?
When the time was ____________, there were ____________ lights on.
Answer:
When the time was 7 hours since midnight,
there were 8 lights on,
Explanation:
Given a scatter plot is made comparing x,
the number of hours since midnight, with y,
the number of lights turned on in a house.
The point at (7, 8) on the scatter plot mean
when the time was 7 hours since midnight,
there were 8 lights were on.
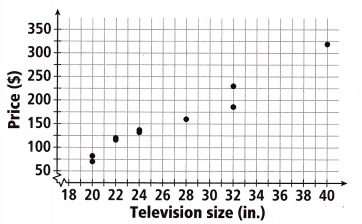
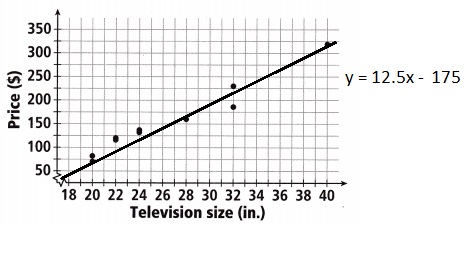
Use the graph to answer Problems 5-7. The slope of the trend line (not shown) is about 12.5.
Question 5.
According to the trend, if Jesse finds a 26-inch television for $75, is that a good deal? Explain.
Answer:
Yes it’s a good deal,
Explanation:
Given Jesse finds a 26-inch television for $75,
the trend line equation for points (20,75), (28,160),
75 = 12.5 X 20 + b,
b = 75 – 250 = -175
is y = 12.5x – 175, as m = 12.5 given and
if x = 26 then y = 12.5 X 26 – 175 = 325 – 175 = $150,
means it would cost $150 but Jesse finds it for only
$75 which is a very good deal.
Question 6.
A 38-inch television is on sale for $250. Raphaela considers this an outlier to the trend shown in the graph because it is not near any of the other data points. Correct her mistake.
Answer:
It is near to the data point (38,280),
Explanation:
Given a 38-inch television is on sale for $250. Raphaela considers this an outlier to the trend
shown in the graph because it is not near any of the other data points. No Raphaela is incorrect it
is near to the point only (38,280) of the trend line.
Question 7.
An increase of 5 inches in television size is associated with an increase of _____________.
(A) $5.00
(B) $12.50
(C) $25.00
(D) $62.50
Answer:
(D) $62.50,
Explanation:
An increase of 5 inches in television size is associated
with an increase of $62.50 as slope is 12.5 means
12.5 X 5 = $62.50 which matches with bit (D).
Spiral Review
Question 8.
Solve the system of equations:
y = 8x + 14
y = 4x + 14
Answer:
x = 0, y = 14,
Explanation:
Given to solve the system of equations:
y = 8x + 14– equation (1)
y = 4x + 14 — equation (2) so multiplying
equation (2) by 2 and subtracting eqaution (1) from
equation (2) as
2y = 8x + 28
-y = – 8x – 14
y = 14, now substituting y = 14 in equation (1) we get
14 = 8x + 14,
8x = 14 – 14= 0, x = 0/8 = 0.
Question 9.
A sprinter runs 100 yards in 10 seconds. A long-distance runner runs a mile in 4 minutes. Find the times it takes each of them to run 10 yards. How much faster is the sprinter over the 10-yard distance?
Answer:
The times it takes each of them to run 10 yards is
for sprinter is 1 second and long-distance runner is
1.36 seconds, Faster is the sprinter over the
10-yard distance is 0.36 seconds,
Explanation:
Given a sprinter runs 100 yards in 10 seconds. A long-distance runner runs a mile in 4 minutes.
Finding the time it takes each of them to run 10 yards.
Sprinter for 10 yards it is 10 yards X 10 seconds / 100 yards = 1 second, As 1 mile is equal to 1,760 yards and 1 minute is 60 seconds, So 4 minutes is 4 X 60 = 240 seconds, So 10 yards
for long-distance runner is 10 yards X 240 seconds/1,760 yards = 1.36 seconds, Therefore the times it takes each of them to run 10 yards is for sprinter is 1 second and long-distance runner is
1.36 seconds, Faster is the sprinter over the 10-yard distance is 1.36 seconds – 1 second = 0.36 seconds.