We included HMH Into Math Grade 8 Answer Key PDF Module 8 Scatter Plots to make students experts in learning maths.
HMH Into Math Grade 8 Module 8 Answer Key Scatter Plots
Statistics and Probability
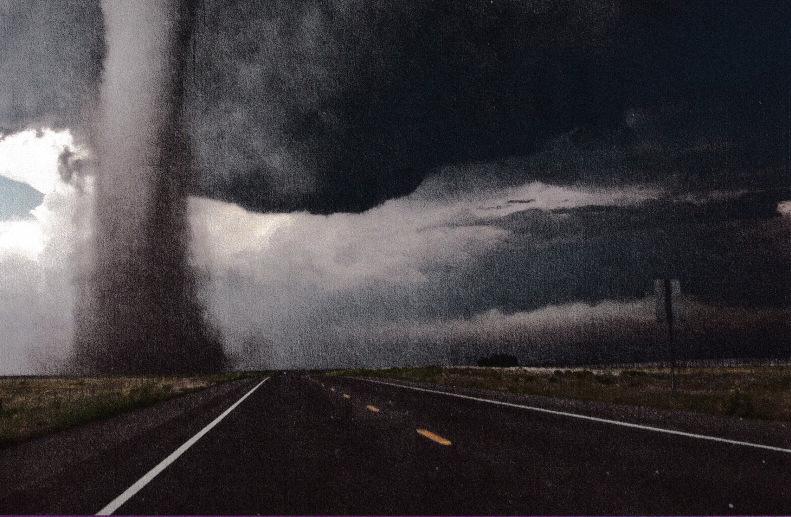
Meteorologists
Meteorologists use scientific processes to study the atmosphere and forecast the weather. They use complex math to model and interpret weather data. You’re probably most familiar with meteorologists who work for television or radio stations. However, meteorologists may also be employed by government agencies, airlines, utility companies, and universities. Modern meteorology relies heavily on computers to produce accurate weather forecasts.

STEM Task:
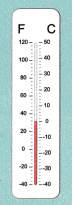
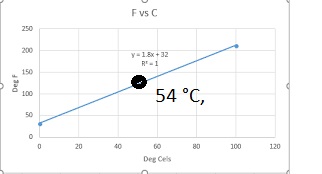
Weather forecasts in the United States usually give temperatures in degrees Fahrenheit (°F), rather than in degrees Celsius (°C). The equation F = 1.8C + 32 relates the two temperature scales. Graph this equation. An air temperature of 129 °F was recorded in Death Valley, California, in 2013. Use your graph to estimate the equivalent temperature in degrees Celsius. Explain your method.
Answer:
Approximately 54 °C,
Explanation:
Given weather forecasts in the United States usually give temperatures in degrees Fahrenheit (°F),
rather than in degrees Celsius (°C). The equation F = 1.8C + 32 relates the two temperature scales.
Graphed this equation. An air temperature of 129 °F was recorded in Death Valley, California, in 2013.
Used my graph to estimate the equivalent temperature in degrees Celsius as at 0°C it is F = 32 °F and plotted for F = 129 °F as 54 °C , because 129 =1.8C + 32, 1.8C = 129 – 32 = 97,
C = 97/1.8 = 53.8888 approximately 54 °C.
Learning Mindset Challenge-Seeking Makes Decisions
Learning something new can be exciting. When you first discover a new interest, the possibilities seem endless. But then you have to make some decisions. For example, how much money can you afford to spend on your new interest? How much time? Is it just a hobby, or do you think you might want to pursue it more seriously, perhaps even as a career? Here are some tips for making important decisions.
- Talk to teachers, parents, and others that you trust. Ultimately you will have to make the final decision yourself, but that doesn’t mean you can’t ask for others’ input.
- Don’t rush. There’s plenty of time ahead of you. Think carefully before you make a decision, especially if you are feeling uncertain or unhappy.
- Don’t be afraid to make a mistake. Very few decisions are irreversible. If you make a decision that doesn’t work out, you can almost always go back and make a different decision.
Reflect
Question 1.
What decisions did you make as you worked on the STEM Task? How did those decisions help you complete the task?
Answer:
Gathered information of Fahrenheit (°F) and solved for degrees Celsius (°C),
Got the results of Celsius and plotted graph,
Explanation:
Decision making is the process of making choices by identifying a decision, So I gathered information about air temperature of 129 °F recordings in Death Valley,
California, in 2013 and these decisions helped me to complete the task by solving and substituting in the equation F = 1.8C + 32 which relates the two temperature scales to find celsius as 54 °C at 129 °F and plotted graph of relation between Fahrenheit (°F) and degrees Celsius (°C).
Question 2.
Think about a decision you made that led to a mistake. What did you learn from it?
Answer:
Decision:
I did not use equation as F = 1.8C + 32 but used as F = 1.8C, I learnt the mistake of not adding 32 to the eqaution,
Explanation:
While finding the Celsius temperature instead of substituting in the equation F = 1.8C + 32, I substituted only F = 1.8C and i got wrong results, Later while checking I learned that I forgot
adding 32 to F = 1.8C.
TAKEN for a RIDE
Use the graphs to answer the questions.
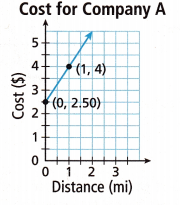
A. The graph shows the cost y of using Company A’s ride sharing service for a trip of x miles. Find the rate of change in the graph. What does it represent?
Answer:
Rate of change in graph is 1.5, It represents that for every mile the cost is increasing by $1.5,
Explanation:
The graph shows the cost y of using Company A’s ride sharing service for a trip of x miles.
We have (x1,y1) as (0,2.5) and (x2,y2) as (1,4) so the rate of change in the graph is (y2-y1)/(x2-x1) =
(4 – 2.5)/(1 – 0) = 1.5, The rate of change in the graph represents that for every mile the cost is increasin by $1.5.
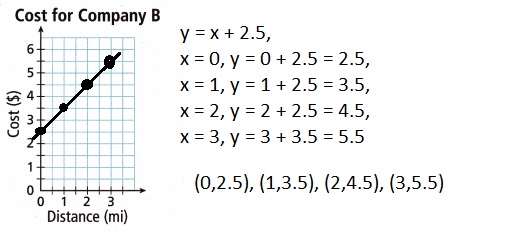
B. Company B wants to compete with Company A. It will have the same initial fee as Company A, but a lower price per mile.
Write the equation of a function that could represent the total cost y of using Company B’s ride sharing service for a trip of x miles. Then graph your equation.
Answer:
y = x + 2.5,
Explanation:
Given Company B wants to compete with Company A.
It will have the same initial fee as Company A but a lower price per mile.
Wrote the equation of a function that could represent the total cost y of using Company B’s ride sharing service for a trip of x miles as y = x + 2.5, Then graph my equation as when x = 0, y = 0 + 2.5 = 2.5, x = 1, y = 1 + 2.5 = 3.5, x = 2 then y = 2 + 2.5 = 4.5 and x = 3 then y = 3 + 2.5 = 5.5, (0,2.5), (1,3.5), (2,4.5) and (3,5.5) as shown above.
Turn and Talk
How does the equation you wrote for Company B indicate the initial fee and the rate of change?
Answer:
Intital fee as $2.5 per mile, Rate of change is 1.0,
Explanation:
The equation y = x + 2.5, I wrote for Company B indicate the initial fee as $2.5 per mile and the rate of change is we have (0,2.5) (1,3.5) so it is (3.5 – 2.5)/(1 – 0) = 1/1 = 1.0.
Are You Ready?
Complete these problems to review prior concepts and skills you will need for this module.
Dot Plots
Question 1.
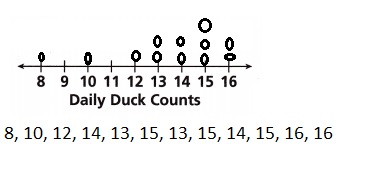
Marie recorded the number of ducks seen at a pond each day for 12 days. The data set is listed.
8, 10, 12, 14, 13, 15, 13, 15, 14, 15, 16, 16
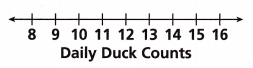
A. Display Marie’s data in the dot plot.
Answer:
Explanation:
Given Marie recorded the number of ducks seen at a pond each day for 12 days. The data set is listed.
8, 10, 12, 14, 13, 15, 13, 15, 14, 15, 16, 16 diplayed Marie’s data in the dot plot as shown above.
B. Describe the center, spread, and overall shape.
Answer:
The center : 14, Spread : between 8 and 16, Shape : Skewed left,
Explanation:
A dot plot, also known as a strip plot or dot chart is a simple form of data visualization that consists of
data points plotted as dots on a graph with an x- and y-axis.
These types of charts are used to graphically depict certain data trends or groupings.
The data set is 8, 10, 12, 14, 13, 15, 13, 15, 14, 15, 16, 16 so it is 8, 10, 12, 13, 13, 14, 14, 15, 15, 15, 16, 16, So center is 14 + 14/2 = 14, Spread is between 8 and 16 and shape is skewed left as the left tail (smaller values) is much longer than the right tail (larger values).
Draw Inferences from Random Samples
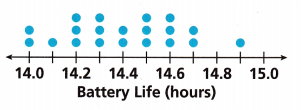
A phone company tested the battery life of a random sample of 20 of its newest model phones. The dot plot shows the company’s results. Use the dot plot to answer Problems 2-3.
Question 2.
Calculate the mean battery life of the phones in the sample.
Answer:
The mean battery life of the phones in the sample is 14.4,
Explanation:
Mean is add up all of the individual values and divide by the total sample size, Here we have
2 X 14 + 1 X 14.1 + 3 X 14.2 + 3 X 14.3 + 2 X 14.4 + 3 X 14.5 + 3 X 14.6 + 2 X 14.7 + 1 X 14.9 / 20 = 28 + 14.1 + 42.6 + 42.9 + 28.8 + 43.5 + 43.8 + 29.4 + 14.9/ 20 = 288/20 = 14.4,
Therefore the mean battery life of the phones in the sample is 14.4.
Question 3.
Based on the sample, how many of the newest phone models in a shipment of 2000 phones can be expected to have a battery life of less than 14.2 hours?
Answer:
500 phones,
Explanation:
As we have seen battery life of a random sample of 20 of its newest model 5 phones have less than 14.2 hour means 5/20 X 100 = 25%, so for the newest phone models in a shipment of 2000 phones can be expected to have a battery life of less than 14.2 hours are 2000 X 25/100 = 500 phones.
Interpret Linear Functions
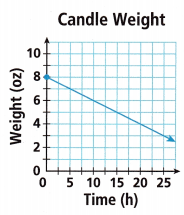
The graph shows the linear relationship between the number of hours a candle burns and the weight in ounces of the candle. Use the graph to answer Problems 4-6.
Question 4.
What is the initial value in this situation, and what does it represent?
Answer:
Intial value is 8 oz,
As time increases the weight of the candle reduces,
Explanation:
Given the graph shows the linear relationship between the number of hours a candle burns and
the weight in ounces of the candle. Used the graph to answer the initial value when it is starting at 0 hours the weight of candle is 8 oz as time increases the candle weight goes on reducing after 5 hours the weight of the candle becomes 3 ounces.
Question 5.
What is the rate of change in this situation, and what does it represent?
Answer:
Rate of change is -1/5, It represents negative change or negative increase,
Explanation:
We have (0,8),(5,7),(10,6),(15,5),(20,4) and (25,3) so the rate of change is we have (0,8) and (5,7) as
(x1,y1) and (x2, y2) so (y2 -y1)/ (x2 – x1), 17 – 8/5 – 0 = -1/5, Here we have negative change or “negative increase.
Because the rate of change is negative here we have the output decreased when the input has increased.
Question 6.
Write the equation of the function.
Answer:
Equation for the function is y = 8 – x and x = 5x,
Explanation:
The equation of the function is y = 8 – x and x = 5x,
When x = 0 then x will be 5 X 0 = 0 and y will be 8 – 0 = 8 so (x, y) = (0,8),
Now if x = 1 then x becomes 5 X 1 = 5 and y = 8 – 1 = 7, (x,y) will be (5,7), Now if x = 2 then x becomes 5 X 2 = 10 and y = 8 – 2 = 6, (x,y) will be (10,6), Now if x = 3 then
x becomes 5 X 3 = 15 and y = 8 – 3 = 5,
(x,y) will be (15,5), Now if x = 4 then x becomes 5 X 4 = 20 and y = 8 – 4 = 4, (x,y) will be (20,4),
Now if x = 5 then x becomes 5 X 5 = 5 and y = 8 – 5 = 3, (x,y) will be (25,3).