We included HMH Into Math Grade 8 Answer Key PDF Module 5 Lesson 3 Interpret and Graph Proportional Relationships to make students experts in learning maths.
HMH Into Math Grade 8 Module 5 Lesson 3 Answer Key Interpret and Graph Proportional Relationships
I Can graph proportional relationships from a table or equation, calculate the unit rate, and determine whether the graph should be continuous or discrete.
Spark Your Learning
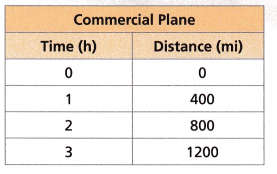
An airplane is traveling toward its destination at a constant speed. The distance that the airplane has traveled at different points in time is shown in the table. How can you find the speed of the airplane?


Answer:
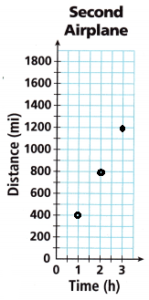
Turn and Talk Predict how the graph of the second airplane’s travel will compare to the graph of the first. What will be the same and what will be different?
Build Understanding
1. The Commercial Plane table in Spark Your Learning shows data that can be graphed on a coordinate plane, where x is the time passed and y is the distance traveled.
A. One of the points is (4, 1600). Describe what this point represents.
__________________
__________________
Answer: The point (4, 1600) represents it takes 4 hours to travel the distance of 1600 miles.
B. The airplane travels at a constant rate, so the relationship between distance and time is proportional. You already know that the unit rate of a proportional relationship can be calculated from any point on a graph of the relationship.
Use the point (3, 1200) to calculate the number of miles that the airplane travels per hour. Show your work.
__________________
Answer:
1200 miles in 3 hours
1200/3 = 400 miles per hour
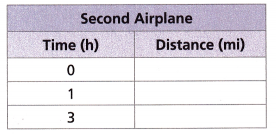
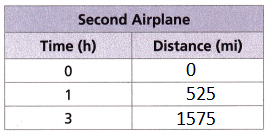
C. A second airplane starts from the same airport and is traveling at a different constant speed. After 4 hours the second airplane has flown 2100 miles from the airport. Calculate the number of miles that the second airplane traveled per hour. Show your work.
__________________
Answer:
4 hr = 2100 miles
1 hour = x
4x = 2100
x = 2100/4
x = 525 miles
Thus the second airplane traveled 525 miles
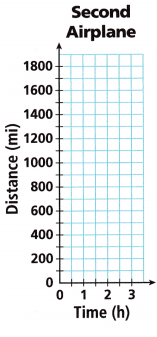
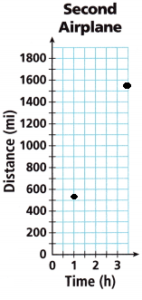
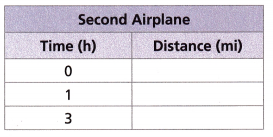
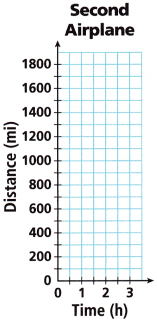
D. Complete the table to show the distance that the second airplane has traveled at different points in time. Graph the points on the coordinate plane.
Answer:
E. What can you conclude about the distance that the two airplanes will have traveled after 8 hours?
____________________________
____________________________
____________________________
Answer:
The unit rate is 1:400
400 miles per hour
8 hours = 8 × 400 = 3200 miles
Turn and Talk Predict how the graph of the second airplane’s travel will compare to the graph of the first. What will be the same and what will be different?
Build Understanding
1. The Commercial Plane table in Spark Your Learning shows data that can be graphed on a coordinate plane, where x is the time passed and y is the distance traveled.
A. One of the points is (4, 1600). Describe what this point represents.
______________________
______________________
Answer: The point (4, 1600) represents it takes 4 hours to travel the distance of 1600 miles.
B. The airplane travels at a constant rate, so the relationship between distance and time is proportional. You already know that the unit rate of a proportional relationship can be calculated from any point on a graph of the relationship.
Use the point (3, 1200) to calculate the number of miles that the airplane travels per hour. Show your work.
______________________
Answer:
1200 miles in 3 hours
1200/3 = 400 miles per hour
C. A second airplane starts from the same airport and is traveling at a different constant speed. After 4 hours the second airplane has flown 2100 miles from the airport. Calculate the number of miles that the second airplane traveled per hour. Show your work.
______________________
Answer:
4 hr = 2100 miles
1 hour = x
4x = 2100
x = 2100/4
x = 525 miles
Thus the second airplane traveled 525 miles
D. Complete the table to show the distance that the second airplane has traveled at different points in time. Graph the points on the coordinate plane.
Answer:
E. What can you conclude about the distance that the airplanes will have traveled after 8 hours?
____________________________
____________________________
Answer:
525 mile per hour
8 hours = 8 × 525 = 4200 miles in hours
Turn and Talk Predict how the graph of the second airplane’s travel will compare to the graph of the first. What will be the same and what will be different?
Step It Out
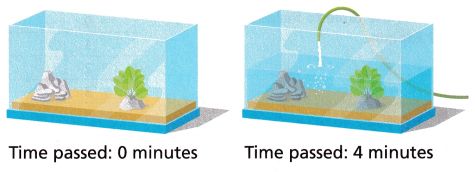
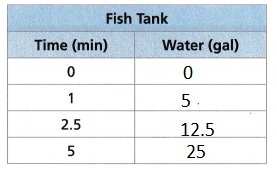
2. A fish tank is filling at a constant rate. The equation modeling the amount of water in the tank is y = 5x, where y represents the amount of water in gallons and x represents the amount of time passed in minutes. Use the equation to complete the table.
A. Substitute 1 for x in the equation to find the amount of water in the tank after 1 minute.
y = 5(![]() )
)
y = ![]()
Enter your answer in the table.
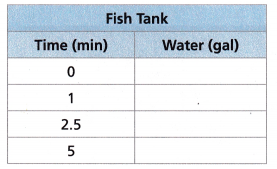
B. Substitute the remaining values for x in the equation and complete the table.
C. Graph the points from the table.
D. Describe what the point (4.5, 22.5) represents.
After ___ minutes, the tank contains ___ gallons.
Answer:
y = 5x
y = 5(1) = 5 gal
y = 5(2.5) = 12.5 gal
y = 5(5) = 25 gal
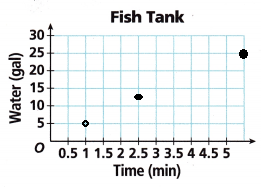
After 4.5 minutes, the tank contains 22.5 gallons.
Connect to Vocabulary
A continuous graph is a graph made up of connected points or curves.
You have used a continuous graph to represent situations, such as an airplane’s distance traveled. A discrete graph is a graph made of unconnected points. It represents data that only make sense at certain points.
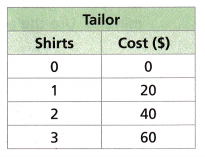
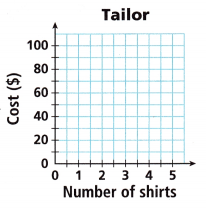
3. The table shows how much a tailor charges to hem different numbers of shirts.
A. Would it make sense for the table to include the cost of hemming 2.5 shirts? Explain.
____________________
____________________
Answer: No, it does not make sense for the table to include the cost of hemming 2.5 shirts. Because we cannot charge for a half shirt.
B. Graph the ordered pairs from the table. Decide whether or not to connect the points with a solid line. Should the graph be discrete or continuous? Why?
____________________
Answer:
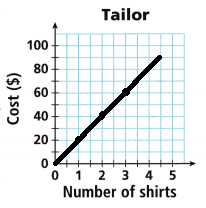
C. How many shirts can a customer have hemmed with $10? With $50?
____________________
Answer:
Half shirt for $10 and 2.5 shirts for $50.
Check Understanding
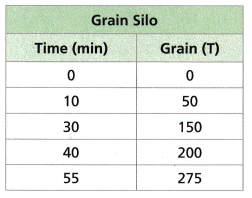
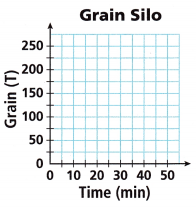
A grain silo is filling at a constant rate. The amount of grain in the silo is given in the following table. Use
the table to answer Problems 1—2.
Question 1.
A. Graph the points ¡n the table. Connect the points with a line if appropriate.
__________________________
B. Should the graph be discrete or continuous? Why?
__________________________
__________________________
Answer:
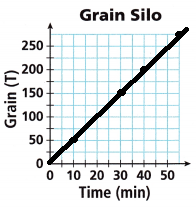
The graph should be discrete.
Question 2.
What is the unit rate per minute at which the grain silo fills?
__________________________
Answer:
(50 – 0)/(10 – 0) = 50/10 = 5
The grain silo is filling at a constant rate.
The unit rate per minute is 5 tons per minute.
Question 3.
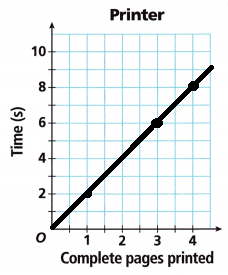
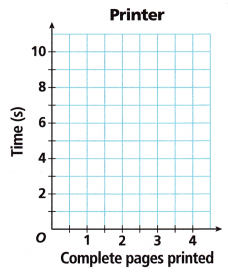
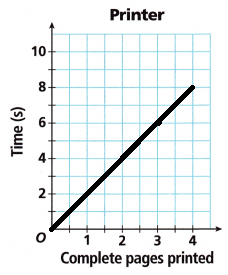
Attend to Precision A printer is printing pages at a constant rate. The table shows the time the printer takes to print different numbers of pages.
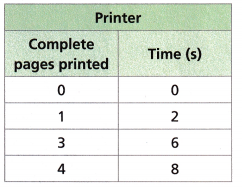
A. Graph the ordered pairs from the table.
Answer:
B. Did you represent the situation with a discrete graph or a continuous graph? Why?
Answer: Discrete graph
C. What does the point (3, 6) represent on the graph?
Answer:
3 printed pages in 6 seconds.
D. Why are the complete pages printed the independent variable?
Construct Arguments For each relationship, decide whether you would represent it with a discrete graph or a continuous graph. Explain your reasoning.
Question 4.
a graph of the cost of shipping different numbers of identical packages
____________________
Answer: Continuous graph
Question 5.
a graph of the amount of fuel remaining in a car’s gas tank while driving
____________________
Answer: continuous graph
Question 6.
a graph of how many students can be transported by different numbers of buses
____________________
Answer: Discrete graph
Question 7.
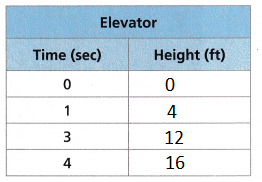
Model with Mathematics An elevator is ascending at a constant rate. The height of the elevator from the ground over time is given by y = 4x, where x represents the amount of time passed in seconds and y represents the height of the elevator in feet.
A. Use the equation to complete the following table.
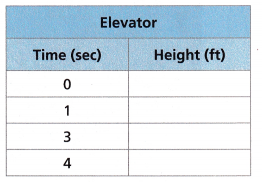
Answer:
y = 4x
x = 0 ⇒ y = 4(0) = 0 ft
x = 1 ⇒ y = 4(1) = 4 ft
x = 3 ⇒ y = 4(3) = 12 ft
x = 4 ⇒ y = 4(4) = 16 ft
B. Graph the height of the elevator in terms of the amount of time that has passed.
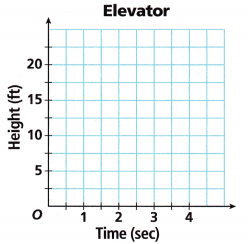
Answer:
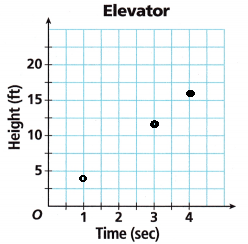
C. Did you draw a discrete graph or a continuous graph?
_________________
Answer: Discrete graph
D. Look at the point on the graph at (1, 4). Describe what this point represents.
_________________
Answer:
1 represents time in second and 4 represents height in feet.
I’m in a Learning Mindset!
How can I modify the task of interpreting and graphing proportional relationships to maintain an appropriate level of challenge?
Lesson 5.3 More Practice/Homework
Question 1.
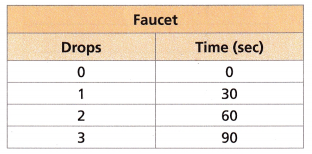
Attend to Precision A faucet is dripping water at a constant rate. The number of drops that the faucet has produced is given in the table:
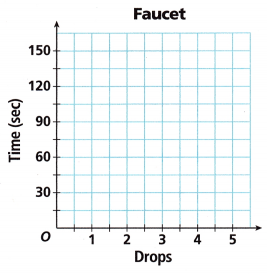
A. Graph the number of drops that drip over time.
Answer:
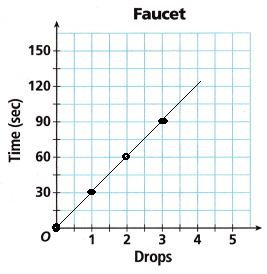
B. Is your graph discrete or continuous? Explain.
Answer:
The above graph is continuous.
C. How long does it take for 12 drops to fall?
Answer:
1 drop = 30 sec
12 drops = 12 × 30 = 360 sec
Thus it takes 360 seconds to fall.
Question 2.
Open Ended Explain how the unit rate of a proportional relationship relates to the slope of its graph. Give a quantitative example.
Answer:
If the relationship between two quantities is a proportional relationship, this relationship can be represented by the graph of a straight line through the origin with a slope equal to the unit rate. The slope is the rate of change and it will remain the same.
For example, 1/4 and 4/16 have a proportional relationship, which means they are the same.
Question 3.
STEM The mass of a substance is equal to its density times its volume. The volume that a mass of water occupies is shown in the given table. Graph the relationship.
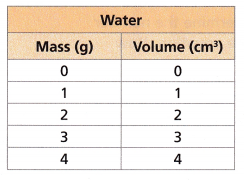
Answer:
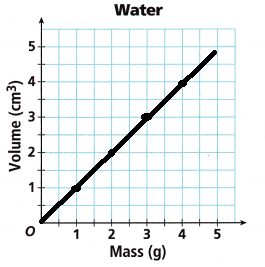
The graph of all the points and the line is shown above.
Test Prep
Question 4.
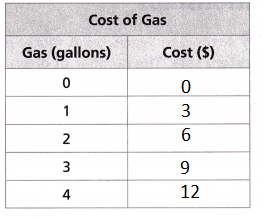
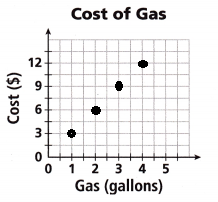
The cost of gas on a particular day is given by the equation y = 3x, where x is the amount of gas purchased in gallons and y represents the cost in dollars. Use the equation to complete the table and to graph the cost versus gallons purchased.
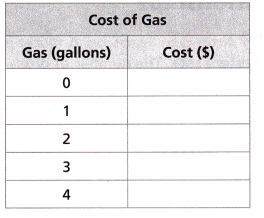
Answer:
y = 3x
y = 3(0) = 0
y = 3(1) = 3
y = 3(2) = 6
y = 3(3) = 9
y = 3(4) = 12
Question 5.
A graph showing the distance a person has walked over time is an example of a (continuous / discrete) graph.
Answer:
The graph shown above is a discrete graph that the distance a person has walked over time.
Spiral Review
Question 6.
In the diagram, which two pairs of angles are alternate interior angles?
____________________
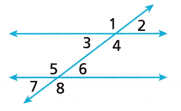
Answer:
∠3 and ∠6 are the alternate interior angles
∠4 and ∠5 are the alternate interior angles
Question 7.
Write and solve an equation to find the value of x.
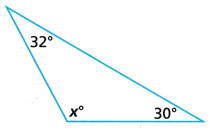
Answer:
Sum of three angles is 180°
32° + x° + 30° = 180°
62° + x° = 180°
x° = 180° – 62°
x° = 118°
Question 8.
Juana and Andy completed 20 math problems total. Juana completed 6 more problems than Andy. Write an equation to determine the number of math problems that Andy completed, then solve the equation. How many of the math problems did Andy complete?
Answer:
Given,
Juana and Andy completed 20 math problems total.
Juana completed 6 more problems than Andy.
6 + 2 × x = 20
6 + 2x = 20
2x = 20- 6
2x = 14
x = 7