We included HMH Into Math Grade 7 Answer Key PDF Module 13 Lesson 3 Compare Means Using Mean Absolute Deviation and Repeated Sampling to make students experts in learning maths.
HMH Into Math Grade 7 Module 13 Lesson 3 Answer Key Compare Means Using Mean Absolute Deviation and Repeated Sampling
I Can use the means and MADs to assess the amount of visual overlap of two numerical data distributions.
Step It Out
Question 1.
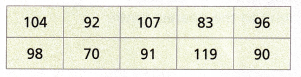
Elia collected data from 10 randomly selected seventh-graders about the number of text messages they sent in one day. Results are shown in the table.

Recall that the mean absolute deviation (MAD) is the average distance from the data points to the mean. It is a measure of the spread of data because it describes the variation of data values from the mean.
A. What is the range of the data? What is the mean number of messages sent in this sample?
Answer:
Given that the data is 104, 92, 107, 83, 96, 98, 70, 91, 119, 90.
The range of the data is the maximum value of the data – minimum value of the data = 119 – 70 = 49.
Mean = sum of the data/number of the data is there
= 104 + 92 + 107 + 83 + 96 + 98 + 70 + 91 + 119 + 90/ 10
= 950/10
Mean = 95
The mean number of messages sent in the sample space is 95.
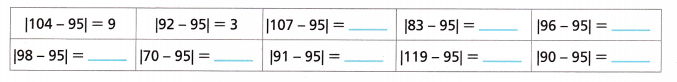
B. Complete the table to show each data point’s absolute deviation, or difference, from the mean.
Answer:
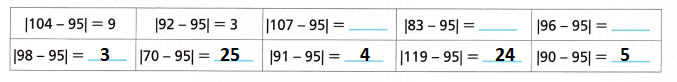
C. Find the sum of the absolute deviations.
Answer:
The sum of the absolute deviations is
104 – 95 = 9
92 – 95 = -3
107 – 95 = 12
83 – 95 = -12
96 – 95 = 1
98 – 95 = 3
70 – 95 = -25
91 – 95 = -4
119 – 95 = 24
90 – 95 = -5
The sum of the absolute deviations is = 9 + 3 + 12 + 12 + 1 + 3 + 25 + 4 + 24 + 5 = 98
D. Find the mean absolute deviation by finding the mean of these absolute deviations. Divide the sum in Part C by the total number of data points.
The mean absolute deviation is ____________ messages.
Answer: The mean absolute deviation is the sum of the deviations/ number of the deviations = 98/10 = 9.8
E. Which data points have an absolute deviation that is less than or equal to the MAD? These data points are said to be within the MAD.
Answer: 104, 92, 96, 98, 91, and 90 data points have an absolute deviation that is less than or equal to the MAD.
These data points are not said to be within the MAD.
Turn and Talk How does the mean absolute deviation describe data differently than the mean of the data?
Answer: Mean absolute deviation means the average distance between each data value and the mean. It is the way to describe the variation in the data sets.
Question 2.
Quentin collected data about the numbers of minutes students spent completing a math puzzle at the beginning of the year and at the end of the year.
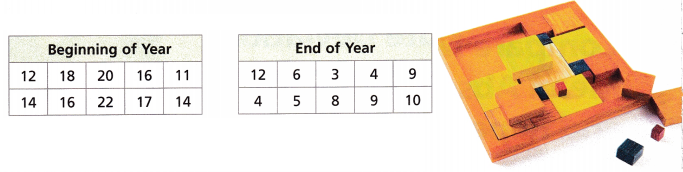
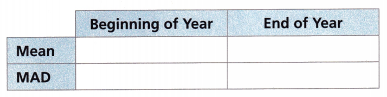
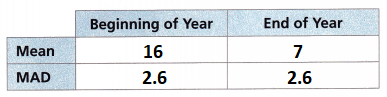
A. Complete the table.
Answer:
The data for the beginning of the year is 12, 18, 20, 16, 11, 14, 16, 22, 17, and 14.
Mean = sum of the data/ number of data is there.
= 12 + 18 + 20 + 16 + 11 + 14 + 16 + 22 + 17 + 14/10.
= 160/10
Mean = 16.
For mean absolute deviation
Find the difference between each data – mean
12 – 16 = -4
18 – 16 = 2
20 – 16 = 4
16 – 16 = 0
11 – 16 = -5
14 – 16 = -2
16 – 16 = 0
22 – 16 = 6
17 – 16 = 1
14 – 16 = -2
Here neglect the negative signs.
Let find the out the average of all the absolute values is 4 + 2 + 4 + 0 + 5 + 2 + 0 + 6 + 1 + 2/10
= 26/10
= 2.6
The mean absolute deviation for the beginning of the year is 2.6.
The data for the end of the year is 12, 6, 3, 4, 9, 4, 5, 8, 9, 10.
Mean = sum of the data/number of the data is there.
= 12 + 6 + 3 + 4 + 9 + 4 + 5 + 8 + 9 + 10/10
= 70/10
= 7
For mean absolute deviation
Find the difference between each data – mean
12 – 7 = 5
6 – 7 = -1
3 – 7 = -4
4 – 7 = -3
9 – 7 = 2
4 – 7 = -3
5 – 7 = -2
8 – 7 = 1
9 – 7 = 2
10 – 7 = 3
Here neglect the negative signs.
Let find the out the average of all the absolute values is 5 + 1 + 4 + 3 + 2 + 3 + 2 + 1 + 2 + 3/10
= 26/10
= 2.6
The mean absolute deviation for the end of the year is 2.6
B. The MAD for these data sets happens to be the same. Compare the difference of the means to the MAD. Round to the nearest tenth.
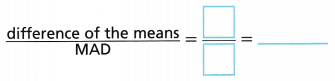
The difference of the means is ___________ times the MAD.
Answer:
The mean for the beginning of the year = 16
The mean for the ending of the years = 7
The mean absolute deviation between the beginning and the ending year is 2.6
The difference of the mean = 16 – 7 = 9
The difference of the mean to the MAD = 9/2.6 = 3.461
The difference in the means is 3.461 times the MAD.
C. When two data sets are displayed in dot plots, the points might overlap a lot, a little, or not at all. The centers might appear to be close or far apart. The ratios of the difference of the means to the MADs can help you predict how much separation there will be between the two distributions. The greater the ratio, the greater the separation. When the MADs of the data sets are similar, these ratios will be similar. These plots show the puzzle-solving data. The yellow shading shows values within the mean absolute deviation.
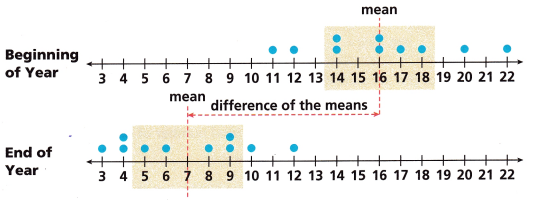
What does the ratio you calculated in Part B tell you about the separation between the two distributions?
Answer:
Question 3.
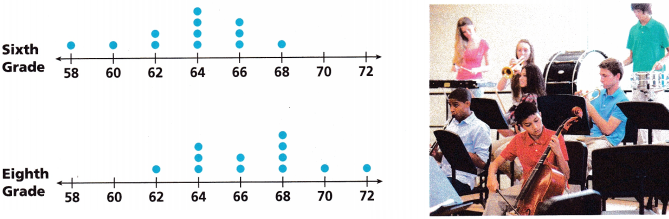
The first plot shows the heights in inches of sixth-grade students in the orchestra. The second shows the heights in inches of eighth-grade students in the orchestra.
A. Complete the table. Round to the nearest tenth.
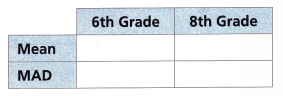
Answer:
The data for sixth grade is 1, 1, 2, 4, 3, 1.
Mean = sum of the data/number of the data is there
= 1 + 1 + 2 + 4 + 3 + 1/ 6
= 12/6
Mean of the sixth grade = 2
For mean absolute deviation
Find the difference between each data – mean
2 – 1 = 1
2 – 1 = 1
2 – 2 = 0
2 – 4 = -2
2 – 3 = -1
2 – 1 = 1
Here neglect the negative signs.
Let’s find out the average of all the absolute values is 1 + 1 + 0 + 2 + 1 + 1/ 6.
6/6 = 0
The mean absolute deviation of the sixth grade is 0.
The data for eighth grade is 1, 3, 2, 4, 1, 1.
Mean = sum of the data/number of the data is there.
= 1 + 3 + 2 + 4 + 1 + 1/ 6
= 12/6
Mean absolute deviation of the eighth grade = 2.
For mean absolute deviation
Find the difference between each data – mean
2 – 1 = 1
2 – 3 = -1
2 – 2 = 0
2 – 4 = -2
2 – 1 = 1
2 – 1 = 1
Here neglect the negative signs.
Let’s find out if the average of all the absolute values is 1 + 1 + 0 + 2 + 1 + 1/ 6
= 6/6
= 0
The mean absolute deviation of the eighth grade is 0
B. For each plot, draw a dashed vertical segment to show the mean. Then, shade the region that shows the values that are within the MAD.
Answer:
C. Find the ratio of the difference of the means to the MAD for each data set. Round to the nearest tenth.
![]()
Answer:
Mean of the sixth grade = 2
Mean of the eighth grade = 2
Mean absolute deviation of sixth and eighth grade is 0
Sixth-grade difference of the means / Mean absolute deviation is = 2-2/0 = 0/0 = 0
Eighth-grade difference of the means / Mean absolute deviation is = 2-2/0 = 0/0 = 0
D. What do the ratios you calculated in Part C tell you about the separation between the two distributions?
Answer:
The ratio of Sixth-grade is difference of the means / Mean absolute deviation is = 2-2/0 = 0/0 = 0
The ratio of Eighth-grade is difference of the means / Mean absolute deviation is = 2-2/0 = 0/0 = 0
These two ratios will separate the two distributions.
Check Understanding
Question 1.
The difference of the means of two data sets is 0.5. Both data sets have a MAD of 1. How does the difference of the means compare to the MADs? If the data were displayed in dot plots, how much overlap would you expect to see? Explain.
Answer:
Question 2.
A survey of adults and teens recorded the daily time in minutes each person spent messaging on a cell phone. These are the results:
Adults: 5, 10, 20, 15, 10 Teens: 50, 60. 40, 10, 80
The MAD for __________ is more than ____________ times the MAD for ________, so the variation for ___________ is much greater than for __________ .
Answer:
Given that,
The data for adults is 5, 10, 20, 15, 10.
Mean = sum of the data/ number of the data are there.
= 5 + 10 + 20 + 15 + 10/5
= 60/5
= 12.
For mean absolute deviation of the adults is
Find the difference between each data – mean
12 – 5 = 7
12 – 10 = 2
12 – 20 = -8
12 – 15 = -3
12 – 10 = 2
Here neglect the negative signs.
Let’s find out if the average of all the absolute values is 7 + 2 + 8 + 3 + 2/5
= 22/5
= 4.4
The mean absolute deviation of the adults is 4.4.
The data for the Teens is 50, 60, 40, 10,80.
Mean = 50 + 60 + 40 + 10 + 80/5
= 240/5
= 48
For mean absolute deviation of the Teens is
Find the difference between each data – mean
48 – 50 = -2
48 – 60 = -12
48 – 40 = 8
48 – 10 = 38
48 – 80 = -32
Here neglect the negative signs.
Let’s find out if the average of all the absolute values is 2 + 12 + 8 + 38 + 32/5
= 92/5
= 18.4
The MAD for Teens is more than 14 times the MAD for adults, so the variation for Teens is much greater than for the adults.
On Your Own
Question 3.
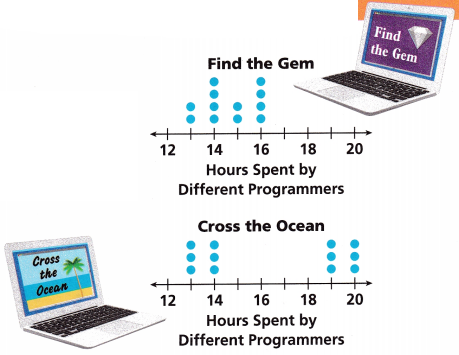
A video game company is developing two games. One group is writing computer code for “Find the Gem.” The other group is writing code for “Cross the Ocean.” The plots show how long each programmer spent writing code for that game.
A. To the nearest tenth, what is the mean of each sample data set?
Find the Gem: _____________
Cross the Ocean: ____________
Answer:
Given that,
The Gem of the data is 2,4,2,4.
Mean = sum of the data/number of the data is there
= 2 + 4 + 2 + 4/4
= 12/4
= 3
3 rounded to the nearest tenth is 0
The Ocean of the data is 3, 3, 3, 3.
= 3 + 3 + 3 + 3/ 4
= 12/4
= 3
3 rounded to the nearest tenth is 0.
B. Which distribution do you predict will have the greater MAD? Why?
Answer:
C. What is the MAD of each data set?
MAD of “Find the Gem” ____________
MAD of “Cross the Ocean” _______________
Answer:
The Gem of the data is 2,4,2,4.
For mean absolute deviation of the Teens is
Find the difference between each data – mean
Mean of the Gem = 3
3 – 2 = 1
3 – 4 = -1
3 – 2 = 1
3 – 4 = -1
Here neglect the negative signs.
Let’s find out if the average of all the absolute values is 1 + 1 + 1 + 1/4
= 4/4
= 1
Mean absolute deviation for the Gem is 1
The Ocean of the data is 3, 3, 3, 3.
For mean absolute deviation of the Ocean is
Find the difference between each data – mean
Mean of the Ocean = 3
3 – 3 = 0
3 – 3 = 0
3 – 3 = 0
3 – 3 = 0
Here neglect the negative signs.
Let’s find out if the average of all the absolute values is 0 + 0 + 0 + 0/4
= 0/4
= 0
Mean absolute deviation of the Ocean is 0.
D. Attend to Precision Complete the statement.
The MAD for “Cross the Ocean” is _____________ times the MAD for “Find the Gem.”
Answer: The MAD for “Cross the Ocean” is 0 times the MAD for “Find the Gem.”
For Problems 4-7, write the approximate ratio of the difference of the means to the MADs for the given data sets. Then tell how much overlap you would expect to see in dot plots of the sample data.
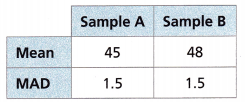
Question 4.
Answer:
Given that,
The mean of sample A is 45.
The mean of sample B is 48.
The approximate ratio of the difference of the means to the MADs is 48 – 45/1.5
= 3/1.5
= 2
The mean absolute deviation of the two samples is 1.5.
You can expert 0 overlapping in the dot plots of the sample data. Because both the mean absolute deviation of the samples A and B are the same.
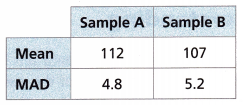
Question 5.
Answer:
The mean of sample A is 112
The mean of sample B is 107
The sample Approximate ratio of the difference of the means to the MADs is 112 – 107/4.8
= 5/4.8
= 1.04
The sample B approximate ratio of the difference of the means to the MADs is 112 – 107/5.2
= 0.96
The difference of two MADs is 5.2 – 4.8 = 0.4
You can expert 0.4 overlapping in the dot plots of the sample data.
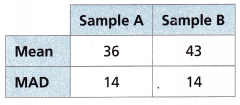
Question 6.
Answer:
The mean of sample A is 36.
The mean of sample B is 43.
The approximate ratio of the difference of the means to the MADs is 43-36/14
= 7/14
= 0.5
Mean absolute deviation of the two samples is 14
You can expert 0 overlapping in the dot plots of the sample data. Because both the mean absolute deviation of the samples A and B are the same.
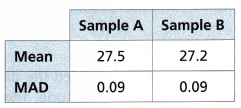
Question 7.
Answer:
The mean of sample A is 45.
The mean of sample B is 48.
The approximate ratio of the difference of the means to the MADs is 27.5 – 27.2/0.09
= 0.3/0.09
= 3.33
The mean absolute deviation of the two samples is 0.09.
You can expert 0 overlapping in the dot plots of the sample data. Because both the mean absolute deviation of the samples A and B are the same
Question 8.
Reason Randomly selected high school students with summer jobs and adult workers were surveyed about their hourly wages in dollars. The data are shown.
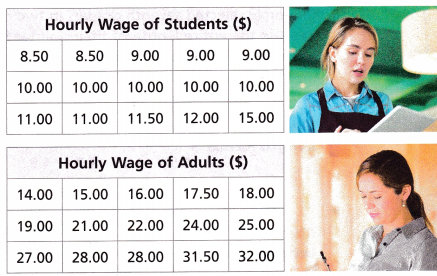
A. What are the mean and MAD of each sample data set rounded to the nearest hundredth?
High school students:
The mean is ____________.
The MAD is ____________.
Adults: The mean is ____________. The MAD is ____________.
Answer:
Given that,
The data for High school students is 8.50, 8.50, 9.00, 9.00, 10.00, 10.00, 10.00, 10.00, 10.00, 11.00, 11.00, 11.50, 12.00, 15.00
Mean = sum of the data / number of data are there
= 8.50 + 8.50 + 9.00 + 9.00 + 10.00 + 10.00 + 10.00 + 10.00 + 10.00 + 11.00 + 11.00 + 11.50 + 12.00 +15.00/15
= 145.5/15
= 9.7
9.7 rounded to the nearest hundredth is 9.70.
Mean absolute deviation for high school.
First, find the difference between the mean and each data.
9.7 – 8.50 = 1.2
9.7 – 8.50 = 1.2
9.7 – 9.00 = 0.7
9.7 – 9.00 = 0.7
9.7 – 10.00 = -0.3
9.7 – 10.00 = -0.3
9.7 – 10.00 = -0.3
9.7 – 10.00 = -0.3
9.7 – 10.00 = -0.3
9.7 – 11.00 = -1.3
9.7 – 11.00 = -1.3
9.7 – 11.00 = -1.3
9.7 – 12.00 = -2.3
9.7 – 15.00 = -5.3
Neglect the negative signs.
Let’s find out if the average of all the absolute values is 1.2 + 1.2 + 0.7 + 0.7 + 0.3 + 0.3 + 0.3 + 0.3 +0.3 + 1.3 + 1.3 + 1.3 + 2.3 + 5.3/15
= 16.8/15
= 1.12
1.12 rounded to the nearest hundredth 1.12
The data for the adults is 14.00, 15.00, 16.00, 17.50, 18.00, 19.00, 21.00, 22.00, 24.00, 25.00, 27.00, 28.00, 28.00, 31.50, 32.00.
Mean = 14.00 + 15.00 + 16.00 + 17.50 + 18.00 + 19.00 + 21.00 + 22.00 + 24.00 + 25.00 + 27.00 + 28.00 + 28.00 + 31.50 + 32.00
= 338/15
= 22.53
22.53 rounded to the nearest hundredth is 22.53
Mean absolute deviation for adults.
First, find the difference between the mean and each data.
22.53 – 14.00 = 8.53
22.53 – 15.00 =7.53
22.53 – 16.00 =6.53
22.53 – 17.50 =5.53
22.53 – 18.00 =4.53
22.53 – 19.00 =3.53
22.53 – 21.00 =1.53
22.53 – 22.00 =0.53
22.53 -24.00 = -1.47
22.53 – 25.00 = -2.47
22.53 – 27.00 = -4.47
22.53 – 28.00 = -5.47
22.53 – 28.00 = -5.47
22.53 – 31.50 = -8.97
22.53 – 32.00 = -9.47
Neglect the negative signs.
Let’s find out if the average of all the absolute values is 8.53 + 7.53 + 6.53 + 5.53 + 4.53 + 3.53 + 1.53 + 0.53 + 1.47 + 2.47 + 4.47 + 5.47 + 5.47 + 8.97 + 9.47/15
= 76.03/15
= 5.06
5.06 rounded to the nearest hundredth is 5.06
B. The MAD for adults is about ____________ times the MAD for the students. This means the variation in the wages for adults is much __________ than the variation in the wages for the students.
Answer: The MAD for adults is about 5.41 times the MAD for the students. This means the variation in the wages for adults is much greater than the variation in the wages for the students.
C. Open-Ended Suggest a change to one hourly wage in the student table so that the MAD will be less than before.
Answer:
Question 9.
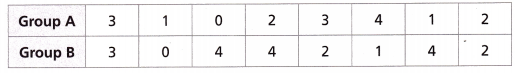
Two groups are each given a bag of beads with letters. Each group randomly selects 20 beads and records the number of vowels in the sample. They each perform the process 8 times. Their data are shown below.
A. What is the mean and MAD, to the nearest hundredth, of each data set?
Group A:
The mean is ___________.
The MAD is ____________.
Group B:
The mean is ____________.
The MAD is ____________.
Answer:
Given that,
The data of Group A is 3, 1, 0, 2, 3, 4, 1, 2.
Mean of the Group A is sum of the data/ number of the data are there.
= 3 + 1 + 0 + 2 + 3 + 4 + 1 + 2/8
=16/8
= 2
Mean of the Group A is 2
Mean absolute deviation for Group 1
First, find the difference between the mean and each data.
2 – 3 = -1
2 – 1 = 1
2 – 0 = 2
2 – 2 = 0
2 – 3 = -1
2 – 4 = -2
2 – 1 = 1
2 – 2 = 0
Neglect the negative signs.
Let’s find out if the average of all the absolute values is 1 + 1 + 2 + 0 + 1 + 2 + 1 + 0/8
= 8/8
= 1
Mean absolute deviation of the Group 1 is 1
The data of Group B is 3, 0, 4, 4, 2, 1, 4, 2.
Mean of the Group B is sum of the data/ number of the data are there.
= 3 + 0 + 4 + 4 + 2 + 1 + 4 + 2/8
= 20/8
= 2.5
The mean of the Group 2 is 2.5
Mean absolute deviation for Group 2
First, find the difference between the mean and each data.
2.5 – 3 = -0.5
2.5 – 0 = 2.5
2.5 – 4 = -1.5
2.5 – 4 = -1.5
2.5 – 2 = 0.5
2.5 – 1 = 1.5
2.5 – 4 = -1.5
2.5 – 2 = 0.5
Neglect the negative signs.
Let’s find out if the average of all the absolute values is 0.5 + 2.5 + 1.5 + 1.5 + 0.5 + 1.5 + 1.5 + 0.5 /8
= 10/8
= 1.25
Mean absolute deviation of the Group 2 is 1.25
B. Construct Arguments If the data for the two groups were displayed in dot plots, how much separation would you expect to see in the distributions? Explain. Support your answer by finding the difference of the means and comparing it to the MADs.
Answer:
Mean of Group A = 2
Mean of Group B = 2.5
Mean absolute deviation of Group A = 1
Mean absolute deviation of Group B is 1.25
The difference of mean is 0.5
The difference of MADs is 0.25.
The difference in mean is greater than the difference of MADs
The difference in the mean is less than the mean absolute deviation of Group A.
The difference in the mean is less than the mean absolute deviation of Group B.
Question 10.
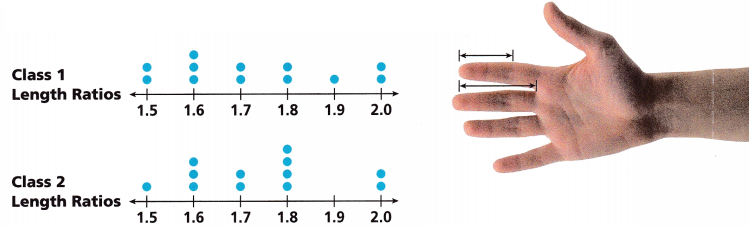
Randomly selected seventh graders in two classes are each asked to measure the entire length of their pointer finger and its length from the tip to the middle joint. The ratio of the lengths is recorded. The data are then organized for each class.
A. Do the two data sets overlap a lot, a little, or not at all?
Answer:
Mean absolute deviation of class 1 is 0.33
Mean absolute deviation of class 2 is 0.88
The difference of the two mean absolute deviations is 0.88 – 0.33 = 0.55
The two data sets overlap a lot with 0.55.
B. What is the mean of each data set to the nearest hundredth?
Class 1: _______________
Class 2: _______________
Answer:
Given that,
The data of class 1 is 2, 3, 2, 2, 1, 2.
Mean = sum of the data/number of the data are there.
= 2 + 3 + 2 + 2 + 1 + 2/6
= 12/6
= 2
2 rounded to the nearest hundredth is 2.00
The mean of the class 1 is 2
The data of class 2 is 1, 3, 2, 4, 2.
Mean = sum of the data/number of the data are there.
= 1 + 3 + 2 + 4 + 2/5
= 12/5
= 2.4
Class 1 = 2
Class 2 = 2.4
2.4 rounded to the nearest hundredth 2.40
C. What is the MAD of each data set to the nearest thousandth?
Class 1: ________________
Class 2: ________________
Answer:
Given that,
The data of class 1 is 2, 3, 2, 2, 1, 2.
Mean absolute deviation class 1
First, find the difference between the mean and each data.
Mean = 2
2 – 2 = 0
2 – 3 = -1
2 – 2 = 0
2 – 2 = 0
2 – 1 = 1
2 – 2 = 0
Neglect the negative signs.
Let’s find out if the average of all the absolute values is 0 + 1 + 0 + 0 + 1 + 0/6
= 2/6
= 1/3
= 0.33
0.33 rounded to the nearest thousandth is 0.330
Mean absolute deviation of the class 1 is 0.33
The data of class 2 is 1, 3, 2, 4, 2.
Mean absolute deviation class 1
First, find the difference between the mean and each data.
Mean = 2.4
2.4 – 1 = 1.4
24 – 3 = -0.6
2.4 – 2 = 0.4
2.4 -4 = -1.6
2.4 – 2 = 0.4
Neglect the negative signs.
Let’s find out if the average of all the absolute values is 1.4 + 0.6 + 0.4 + 1.6 + 0.4/5
= 4.4/5
= 0.88
0.88 rounded to the nearest thousandth is 0.880
The mean absolute deviation of class 2 is 0.88
Class 1 = 0.33
Class 2 = 0.88
D. Use the means and MADs above to approximate the ratio of the difference of the means to the MADs for each data set. Round your ratios to the nearest hundredth.
Class 1: ________________
Class 2: ________________
Answer:
For class 1 the approximate the ratio of the difference of the means to the MADs = difference of means/ mean absolute deviation = 2.4 – 2/0.33 = 1.21
1.21 rounded to the nearest hundredth is 1.21
For class 2 the approximate the ratio of the difference of the means to the MADs = difference of means/ mean absolute deviation = 2.4 – 2/0.88 = 0.45
0.45 rounded to the nearest hundredth is 0.45
E. Do your answers to Part D support your answer to Part A? Explain.
Answer:
The answers to part A and part D are different.
Part A shows the difference in mean absolute deviation for overlapping.
Part D shows the approximate ratio of the difference of the means to the MADs.
F. Do you think there are meaningful differences in the two data sets? Explain.
Answer:
Yes, there is a meaningful difference between the two data sets.
The differences are found by the ratios of difference in means by mean absolute deviation.
Lesson 13.3 More Practice/Homework
Question 1.
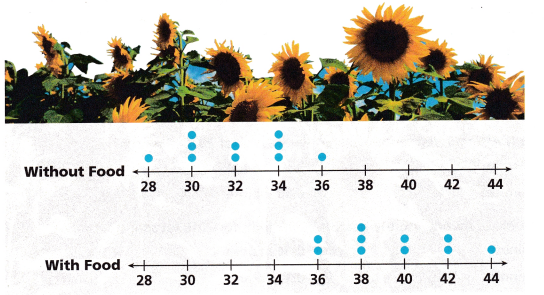
STEM Akuchi is experimenting with the effect of using plant food on the growth of sunflowers. The dot plots show the heights in inches of randomly selected sunflowers.
A. What is the mean height of sunflowers in each sample data set?
Without food, the mean height is _____________ inches.
With food, the mean height is ____________ inches.
Answer:
The data without food is 1, 3, 2, 3, 1
Mean = sum of the data/ number of the data is there
= 1 + 3 + 2 + 3 + 1/5
= 10/5
= 2
The data with food is 2, 3, 2, 2, 1
Mean = sum of the data/ number of the data is there
= 2 + 3 + 2 + 2 + 1/ 5
= 10/5
= 2
Without food, the mean height is 2 inches.
With food, the mean height is 2 inches.
B. What is the mean absolute deviation in height for each data set?
The MAD without food is ____________. The MAD with food is ____________.
Answer:
Mean absolute deviation without food
First, find the difference between the mean and each data.
Mean = 2
2 – 1 = 1
2 – 3 = -1
2 – 2= 0
2 – 3 = -1
2 – 1 = 1
Neglect the negative signs.
Let’s find out if the average of all the absolute values is 1 + 1 + 0 + 1 + 1/5
= 4/5
= 0.8
Mean absolute deviation of with food
First, find the difference between the mean and each data.
Mean = 2
2 – 2 = 0
2 – 3 = -1
2 – 2 = 0
2 – 2 = 0
2 – 1 = 1
Neglect the negative signs.
Let’s find out if the average of all the absolute values is 0 + 1 + 0 + 0 + 1/ 5
= 2/5
= 0.4
The MAD without food is 0.8. The MAD with food is 0.4.
C. Are the data distributions visually separate? Explain why you would or would not expect them to be.
Answer:
Question 2.
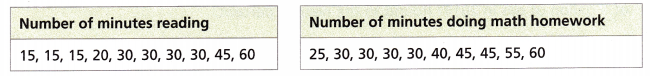
Math on the Spot The tables show the number of minutes per day students spend outside of school reading and doing their math homework.
What is the difference of the means as a multiple of the approximate mean absolute deviations?
Answer:
Given that,
The data for the number of minutes read is 15, 15, 15, 20, 30, 30, 30, 30, 45, and 60.
Mean = sum of the data/ number of the data is there
15 + 15 + 15 + 20 + 30 + 30 + 30 + 30 + 45 + 60/10
= 290/10
= 29.
For mean absolute deviation.
First, find the difference between the mean and each data.
29 – 15 = 14
29 – 15 = 14
29 – 15 = 14
29 – 20 = 9
29 – 30 = -1
29 – 30 = -1
29 – 30 = -1
29 – 30 = -1
29 – 45 = -16
29 – 60 = -31
Neglect the negative signs.
Let’s find out if the average of all the absolute values is 14 + 14 + 14 + 9 + 1 + 1 + 1 + 1 + 16 + 31 = 102/10
= 10.2
The mean absolute deviation of the number of minutes read is 10.2
The data for the number of minutes doing math homework is 25, 30, 30, 30, 30, 40, 45, 45, 55, and 60.
Mean = 25 + 30 + 30 + 30 + 30 + 40 + 45 + 45 + 55 + 60
= 390/10
= 39
For mean absolute deviation.
First, find the difference between the mean and each data.
39 – 25 = 14
39 – 30 = 9
39 – 30 = 9
39 – 30 = 9
39 – 30 = 9
39 – 40 = -1
39 – 45 = -6
39 – 45 – -6
39 – 55 = -16
39 – 60 = -21
Neglect the negative signs.
Let’s find out if the average of all the absolute values is 14 + 9 + 9 + 9 + 9 + 1 + 6 + 6 + 16 + 21/10
100/10
= 10.
The mean absolute deviation of the number of minutes doing math homework is 10.
The difference of the means as a multiple of the approximate mean absolute deviations is
The difference of means/ mean absolute deviations of the number of minutes reading = 39 – 29 /10.2 = 10/10.2 = 0.98
The difference of means/ mean absolute deviations of the number of minutes doing the math homework = 39 – 29/10 = 10/10 = 1
Test Prep
Use this information for Problems 3 and 4.
Aubree recorded the duration in minutes of randomly selected hit songs from two different years. Her data are represented in the dot plots below.
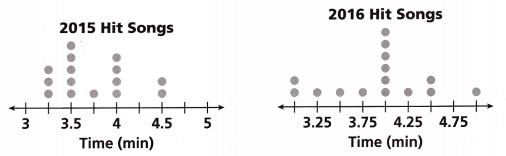
Question 3.
What is the MAD, rounded to the nearest hundredth, for 2015 hit songs?
(A) 0.03 minute
(B) 0.23 minute
(C) 0.35 minute
(D) 0.50 minute
Answer:
The data for the 2015 hit songs is 3, 5, 1, 4, 2
Mean = sum of the data/number of the data is there.
= 3 + 5 + 1 + 4 + 2
= 15/5
= 3
For mean absolute deviation.
First, find the difference between the mean and each data.
3 – 3 = 0
3 – 5 = -2
3 – 1 = 2
3 – 4 = -1
3 – 2 = 1
Neglect the negative signs.
Let’s find out if the average of all the absolute values is 0 + 2 + 2 + 1 + 1/ 5
6/5
= 1.2
1.2 rounded to the nearest hundred is 0.12
Question 4.
What is the MAD, rounded to the nearest hundredth, for 2016 hit songs?
(A) 0.03 minute
(B) 0.38 minute
(C) 0.04 minute
(D) 0.41 minute
Answer:
The data for the 2016 hit songs is 2, 1, 1, 1, 6,1, 2, 1
Mean = 2 + 1 + 1 + 1 + 6 + 1 + 2 + 1/ 8
= 15/8
= 1.875
1.875 -2 = -0.125
1.875 – 1 = 0.875
1.875 – 1 = 0.875
1.875 – 1 = 0.875
1.875 – 6 = -4.125
1.875 – 1 = 0.875
1.875 – 2 = -0.125
1.875 – 1 = 0.875
Neglect the negative signs.
Let’s find out if the average of all the absolute values is 0.125 + 0.875 + 0.875 + 0.875 + 4.125 + 0.875 + 0.125 + 0.875/ 8
= 8.75/8
= 1.093
1.093 rounded to the nearest hundred is 1.09
Spiral Review
Question 5.
The box plots represent data for the average daily temperatures in January for two cities in Colorado at different altitudes.
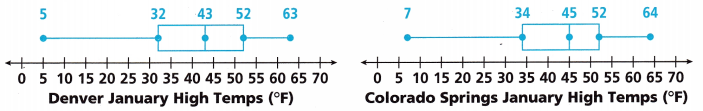
How do the medians compare?
Answer:
The Median is compared by the numerical values separated by the higher half of the sample and the lower half of the sample.
The median means the middle value of the data.
The median of the Denver January high temps = 43
The median of the Colorado Springs January High Temps = 45
The median of Colorado Springs January High Temps is greater than Denver’s January high temps
Question 6.
The average cost of a gallon of gas in January 2014 was $3.42, and was $2.36 in December 2014. What was the percent change in the average cost of a gallon of gas in 2014? Round to the nearest percent.
Answer:
Given that,
The average cost of a gallon of gas in January 2014 was = $3.42.
The average cost of a gallon of gas in December 2014 was = $2.36
The percent change in the average cost of a gallon of gas in 2014 = $3.42 – $2.36 = 1.06 = 106%
106% rounded to the nearest percent is 110%
Question 7.
A recipe for one batch of dough calls for 2\(\frac{3}{4}\) cups of flour. Thomas is making 2\(\frac{1}{2}\) batches of the recipe. How many cups of flour does he need?
Answer:
Given that,
For one batch of dough = 2\(\frac {3}{4} \) cups of flour = 2 x 3/4
Thomas is making 2\(\frac {1}{2} \) batches of the recipe = 2 x 1/2
The number of cups needed for the Thomas = 2 x 3/4(2 x 1/2)
= 1.5 x 1
= 1.5
Thomas needs 1.5 cups of flour.