We included HMH Into Math Grade 7 Answer Key PDF Module 1 Lesson 4 Recognize Proportional Relationships in Graphs to make students experts in learning maths.
HMH Into Math Grade 7 Module 1 Lesson 4 Answer Key Recognize Proportional Relationships in Graphs
I Can decide whether a relationship shown in a graph is proportional and explain the connection between the constant of proportionality and the point (1, r) on the graph.

Spark Your Learning
Jake makes custom-painted sneakers. He makes 6 pairs in 4 hours. On a graph of this proportional relationship, what point would represent 6 pairs in 4 hours? Justify your answer with a description or model.

Turn and Talk How did you decide which axis represents which variable? Explain.
Build Understanding
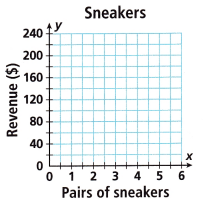
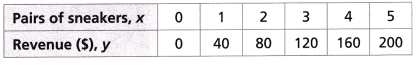
1. The table shows the proportional relationship between pairs of sneakers Jake makes to sell at a craft fair and the revenue from selling them.
A. How do the data in the table show a proportional relationship? How do you know?
___________________
Answer:
For the proportional relationship find the ratios of pairs of sneakers and Revenue is k = y/x
0/0 = 0
40/1 = 40
80/2 = 40
120/3 = 40
160/4 = 40
200/5 = 40
The ratio of the table is not equal. So, the data is not a proportional relationship.
B. Write the data in the table as ordered pairs and graph them.
___________________
Answer:
The ordered pairs are (0,0), (1,40), (2,80), (3,120), (4,160), (5, 200)
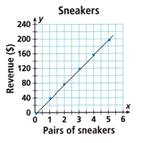
C. Do the points all lie along a straight line? ___________________
Answer: Yes, the all points lie on the straight line
D. Does the graph pass through the origin? ___________________
Answer: Yes, the graph pass through the origin.
Turn and Talk Describe the characteristics of the graph of a proportional relationship.
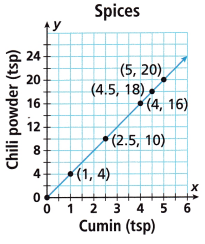
2. Maya sells homemade spice mixes in different sizes at the craft fair. The graph shows the proportional relationship between teaspoons of cumin and teaspoons of chili powder in one recipe.
A. What does the origin represent?
__________________
Answer:
The origin represents the starting point.
The origin represents (0,0).
B. What are the coordinates of the point at x = 1, and what do they represent?
_______________________
_______________________
_______________________
Answer:
The coordinates of the point at x = 1 represents the (1,4).
The point (1,4) represents the 1 table spoon of cumin for 4 table spoons of chili power.
C. Explain why the graph shows a proportional relationship.
_______________________
_______________________
Answer:
The graph represents the straight line and the line passes through the origin. And it has a constant slope. So, it is a proportional relationship.
D. Why is the graph a solid line?
_______________________
_______________________
Answer:
The solid line means the graph is continuously changing between the graphed points.
In the given graph the points are continuously changing so, it is a solid line.
Step It Out
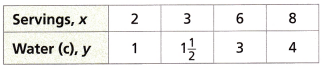
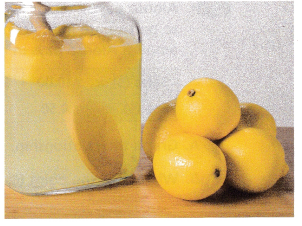
3. Parker sells lemonade at the craft fair. The relationship between the number of servings and cups of water used is shown.
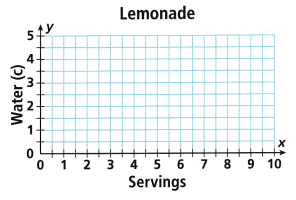
A. Graph the relationship, and tell whether it is a proportional relationship. Explain how you know.
______________________
______________________
Answer:
For the proportional relationship Divide Water by servings It means find the ratio of Water and savings is k = y/x
1/2 = 0.5
1 x 1/2 /3 = 1.5/3 = 0.5
3/6 = 1/2 = 0.5
4/8 = 1/2 = 0.5
All the ratios are equal. So, it is a proportional relationship.
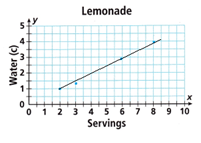
B. The graph of the line should be (solid / dashed) because x and y can be any nonnegative numbers.
Answer:
The graph of the line should be solid because x and y can be any nonnegative numbers.
C. What is the constant of proportionality? Write an equation for the relationship.
______________________
Answer:
The equation of the relationship is y = 0.5x
If x = 2 then y = 0.5(2) = 1
If x = 3 then y = 0.5(3) = 1.5 = 1 x1/2.
If x= 6 then y = 0.5(6) = 3
If x = 8 then y = 0.5(8) = 4.
The constant proportionality is 0.5.
4. Angel was in charge of ordering graphic T-shirts for the craft fair. The graph shows the relationship between the number of boxes of T-shirts Angel ordered x and the total number of T-shirts y.
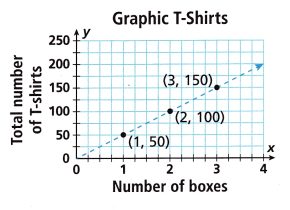
A. Is the relationship in the graph a proportional relationship? Explain how you know.
______________________
______________________
Answer:
For the proportional relationship.
Find the ratios of the Number of boxes and the total number of T-shirts.
Proportional relationship k = y/x
50/1 = 50
100/2 = 50
150/3 = 50
All the ratios are equal. So, it is a proportional relationship.
B. What is the constant of proportionality? How do you know based on the graph?
______________________
Answer:
Find the ratios of the Number of boxes and the total number of T- shirts.
Proportional relationship k = y/x
50/1 = 50
100/2 = 50
150/3 = 50
The constant of proportionality is 50.
C. Write an equation to represent the relationship.
______________________
Answer:
Answer:
The equation that represents the relationship is
y = 50x
If x = 1 then y = 50(1) = 50.
If x = 2 then y = 50(2) = 100.
If y = 3 then y= 50(3) = 150.
D. Why is the graph dashed rather than solid?
______________________
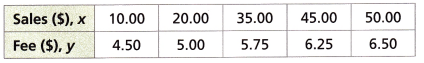
5. Alonso pays a fee of $4 plus a percentage of his sales to participate in the crafts fair. The table shows the amount Alonso pays in relationship to his sales.
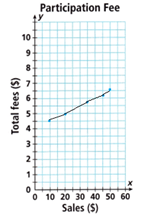
A. Graph the relationship.
Answer:
The ordered pairs are (10, 4.50), (20, 5), (35, 5.75), (45, 6.25), (50, 6.50).
B. What does the point (0, 4.00) represent?
__________________
__________________
__________________
Answer:
The point (0, 4.00) represents
x = 0 and y = 4
For 0 sales the total fee is 4.
C. Is the ratio of [lartex]\frac{y}{x}[/latex] constant? Justify your answer. o ‘
_____________________
_____________________
Answer:
The ratio of y /x is
4.50/10 = 0.45
5/20 = 0.25
5.75/30 = 0.19
6.25/45 = 0.13
6.50/50 = 0.13
The ratio of y/x is not constant.
D. Is the relationship between the total fees and the amount of sales a proportional relationship? Explain.
_____________________
Answer:
For the proportional relationship, the ratios of the total fees and the number of sales is k = y/x
4.50/10 = 0.45
5/20 = 0.25
5.75/30 = 0.19
6.25/45 = 0.13
6.50/50 = 0.13
All the ratios of the total fee and the number of sales is not equal. So the total fee and the number of sales is not a proportional relationship.
Check Understanding
Question 1.
Amber works at the doggy daycare after school.
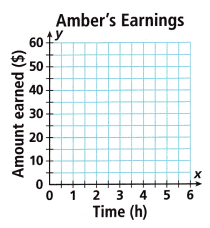
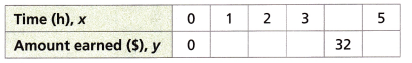
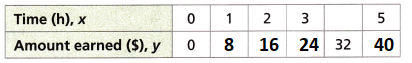
A. Use the information in the photograph to complete the table and make a graph of the data.
Answer:
From the table the equation is y = 8x
If x = 0 then y = 8(0) = 0
If x = 1 then y = 8(1) = 8
If x = 2 then y = 8(2) = 16
If x = 3 then y = 8(3) = 24
If x= 4 then y = 8(4) = 32
If x = 5 then y = 8(5) = 40.
B. Is the relationship between the amount Amber earns and the number of hours a proportional relationship? Explain.
Answer:
For the proportional relationship find the ratios the amount of Amber earns and the number of hours is k = y/x
0/0 = 0
8/1 = 8
16/2 = 8
24/3 = 8
32/4 = 8
40/5 = 8
All the ratios are not equal. So, the relationship between the amount Amber earns and the number of hours is not a proportional relationship.
C. What point represents the constant of proportionality?
_____________________
Answer:
The constant of proportionality for $8 per hour is k = y/x = 8/1 = 8
The constant of proportionality is 8.

D. What is the ratio \(\frac{y}{x}\) for each point on the graph?
_____________________
Answer:
The ratio of y/x for each point is
0/0 = 0
8/1 = 8
16/2 = 8
24/3 = 8
32/4 = 8
40/5 = 8
On Your Own
Question 2.
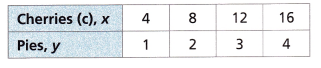
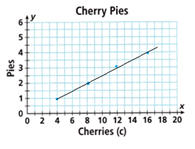
Model with Mathematics The table shows the amounts of cherries (in cups c) used to bake pies.
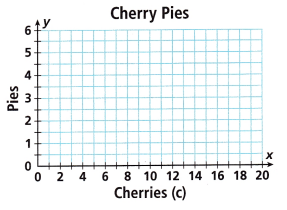
Make a graph of the data. Tell whether the relationship between the amounts of cherries and the number of pies is a proportional relationship. Explain. If the relationship is proportional, write an equation for the relationship.
_____________________
_____________________
_____________________
Answer:
The relationship between the amounts of cherries and the number of pies is k = y/x is
1/4 = 0.25
2/8 = 0.25
3/12 = 0.25
4/16 = 0.25.
All the ratios of the amounts of cherries and the number of pies are equal. So, the relationship between the amounts of cherries and the number of pies is a proportional relationship.
Question 3.
The graph shows the distance x Yazmin jogs and the amount of time y that it takes her. Y
A. What is the meaning of the point (1, 16) on the graph?
__________________
__________________
Answer:
In the point (1, 16)
1 represents the miles.
16 represents the minutes.
The meaning of the point (1, 16) on the graph is that Yazmin jogs 1 mile in 16 minutes.
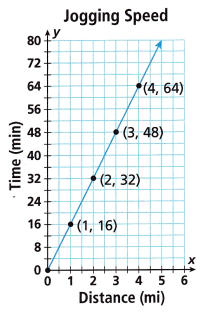
B. Does the graph show a proportional relationship? If so, what is the constant of proportionality k? What is the equation of the graph? Explain your reasoning.
___________________
___________________
___________________
Answer:
For the proportional relationship
The ratio of distance and the time is
k = y/x = 16/1 = 16
32/2 = 16
48/3 = 16
64/4 = 16
All the ratios of distance and time is equal. So, it is a proportional relationship.
The constant of proportionality is k = 16.
The equation of the graph is y = 16x.
C. Open Ended Describe how the graph would be different if Yazmin’s jogging rate were a different constant.
_____________________
_____________________
_____________________
Answer:
Question 4.
Model with Mathematics Henry goes to the town fair. Use the prices on the photograph to complete the table and graph the data.
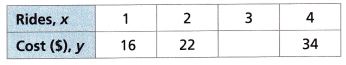

A. Do the points in the table show a constant ratio of total cost to number of rides? Give an example from the table.
____________________
____________________
Answer:
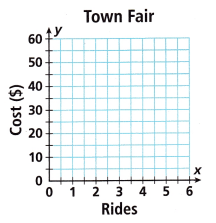
B. Does the graph show a proportional relationship? Why or why not?
____________________
____________________
Answer:
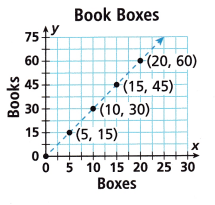
Tell whether the graph shows a proportional relationship. Explain.
Question 5.
Answer:
Given that,
The ordered pairs are (5,15), (10,30), (15, 45), (20, 60).
For the proportional relationship divide the books and the boxes.
We have k = y/x
15/5 = 3
30/10 = 3
45/15 = 3
60/20 = 3
All the ratios of books and the boxes are equal. So, the books and the boxes are a proportional relationship.
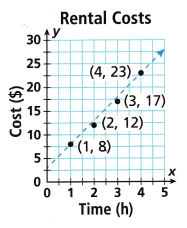
Question 6.
Answer:
Given that,
The ordered pairs is (1,8), (2,12), (3,17), (4,23).
For the proportional relationship find the ratios of cost and the time.
We have k = y/x
8/1 = 8
12/2 = 6
17/3 = 5.6
23/4 = 5.75
All the ratios of cost and time are not equal. So, the cost and the time do not have a proportional relationship.
I’m in a Learning Mindset!
How can I make the process of writing a proportional relationship for a graph more efficient?
Lesson 1.4 More Practice/Homework
Question 1.
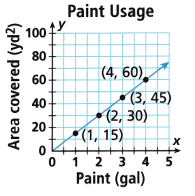
The graph shows the area y that can be covered by a given amount of paint x when using a paint sprayer.
A. Does the graph show a proportional relationship? Explain.

____________________
___________________
Answer:
The ordered pairs are (1,15), (2, 30), (3, 45), (4,60).
For the proportional relationship find the ratios of paint and area covered is k = y/x
15/1 = 15
30/2 = 15
45/3 = 15
60/4 = 15.
All the ratios of the paint and the area covered is equal. So, the paint and the area covered is a proportional relationship.
B. Using the point (3, 45), find the constant of proportionality k and write an equation that describes the proportional relationship.
_____________
Answer:
Given that,
The points are (3, 45)
Here x = 3 and y = 45
The constant of proportionality is k = y/x = 45/3 = 15
The constant of proportionality is 15.
The equation describes the proportional relationship is y = 15x
Question 2.
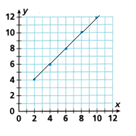
Construct Arguments Graph the data from the table.
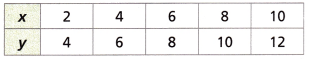
Does the graph show the relationship is a proportional relationship? Does the relationship have a constant of proportionality? Justify your answer using any two points from the table.
Answer:
For the relationship is proportional relationship find the ratios of x and y is k = y/x
4/2 = 2
6/4 = 1.5
8/6 = 1.3
10/8 = 1.25
12/10 = 1.2
All ratios of x and y are not equal. So, the value of x and y are not proportional relationship.
The relationship does not have a constant proportionality.
Question 3.
Open Ended Think of a proportional relationship you may see in your daily life. Make a table of data and graph the data. Explain how you know that the data show a proportional relationship.
Answer:
The proportional relationship you may see in your daily life is the table shows the cost of pens at the shop. And find whether the data is a proportional relationship or not.
For the proportional relationship find the ratios of pens and the cost.
K = y/x = 10/1 = 10
20/2 = 10
30/3 = 10
40/4 = 10
All the ratios are equal in the table. So, the cost of pens at the shop is proportional to relational.
To know that the data show a proportional relationship for that find the ratios of the data. If the ratios of the data are equal then it is a proportional relationship.
Test Prep
Question 4.
The table shows the costs of books at the library book sale. Select all the ordered pairs that would be on the graph of this relationship.
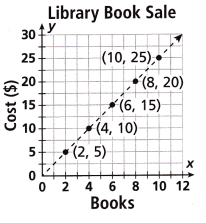
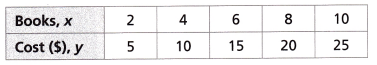
A. (3, 7.5)
B. (12, 33)
C. (9, 22.5)
D. (11, 27)
E. (5, 12.5)
Answer:
The ordered pairs that would be on the graph of this relationship is (3, 7.5), (5,12.5), and (9, 22.5).
Option A, E, C is the correct answer.
Question 5.
Sonia plays a computer game and completes puzzles during levels of the game. The data are shown in the graph.
What does the point (1, 3) on the graph represent?
A. Sonia completes 1 puzzle every 3 levels.
B. Sonia completes 3 puzzles on each level.
C. Sonia completes 1 puzzle on level 3.
D. Sonia completes puzzles 1 to 3.
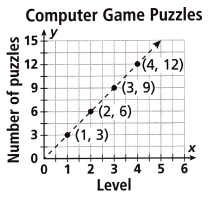
Answer:
The point (1, 3) on the graph represent that Sonia completes 3 puzzles on each level.
Option B is the correct answer.
Spiral Review
Question 6.
There are 12 girls and 14 boys in class today. What is the ratio of girls to boys?
__________________
Answer:
Given that,
The total number of girls in the class are 12
The total number of boys in the class are 14
The ratio of girls to boys is 12/14 = 0.857.
Question 7.
A bakery charges $14.00 for 4 croissant sandwiches. What is the unit rate?
__________________
Answer:
Given that,
A bakery charges $14.00 for 4 croissant sandwiches.
The unit rate is $14/4 = $3.5 charges/sandwiches.
Question 8.
The table shows how many pages Andy reads. Does Andy read at a constant rate? Explain.
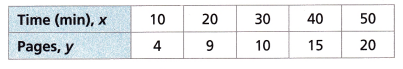
Answer:
The constant rate is
y2 – y1/x2 – x1 = 9 – 4/20 – 10 = 5/10 = 1/2
10 – 9/30 – 20 = 1/10
15 – 10/40 – 30 = 5/10= 1/2
20 – 15/50 – 40= 5/10 = 1/2
Andy not read at the constant rate.
Because it is a linear data.