We included HMH Into Math Grade 6 Answer Key PDF Module 6 Lesson 1 Use Ratio Reasoning with Circle Graphs to make students experts in learning maths.
HMH Into Math Grade 6 Module 6 Lesson 1 Answer Key Use Ratio Reasoning with Circle Graphs
I Can use reasoning about equivalent ratios to make and interpret a circle graph.
Spark Your Learning
In a music competition, the ratio of guitarists to all musicians is 5:8. There are 64 musicians in the competition. Of the guitarists, 32 play jazz solos and the rest play classical solos. How could you represent the portion of all musicians who play jazz guitar solos and the portion who play classical guitar solos both numerically and visually?

Turn and Talk Is there another visual representation that could be used to display this situation? Explain.
Answer:
In a music competition, the ratio of guitarists to all musicians is 5:8.
There are 64 musicians in the competition.
5/8 × 64 = 5 × 8 = 40
Of the guitarists, 32 play jazz solos and the rest play classical solos.
5/8 × 32 = 5 × 4 = 20
Build Understanding
A circle graph shows how a whole set of data is divided into parts or categories. The size of the angle for a section indicates the portion of the whole that the category makes up. The sum of all the angle measures is 360°, the measure of one full rotation around a circle.
Connect to Vocabulary
A circle graph is a graph that uses sections of a circle to compare parts to the whole and parts to other parts.
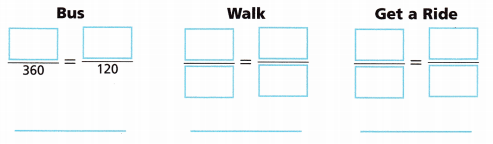
1. Kara conducted a survey of 120 students. She asked how they get to school. The results are shown in the circle graph.
A. What do the sizes of the sections tell you about how the number of students who walk to school compares to the number who take the bus?
_________________
_________________
_________________
Answer:
The above circle graphs tells us that one-fourth of the students goes to school by ride and three-fourth of the students goes to school by walk and bus.
1/4 × 360 = 90
3/4 × 360 = 270
B. How can you find the angle measure of each section? What are the angle measures?
Answer: By using the protractor we can find the angle measure of each section.
C. Write part-to-whole ratios comparing the angle measure for each section to the angle measure for the whole circle, 360°.
_________________
Answer:
Angle measure for students go by walk = 30 degrees
Angle measure for students go by bus = 240 degrees
Angle measure for students get a ride = 90 degrees
D. Use your part-to-whole ratios from Part C to find the number of students represented by each section.
Answer:
Bus:
x/360 = 90/120
x = 80/120 × 360 = 240
Bus = 240 degrees
Walk:
x/360 = 10/120
x = 10/120 × 360 = 30 degrees
Get a ride:
x/360 = 1/4
x =1/4 × 360 = 90 degrees
Step It Out
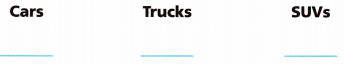
2. There are 45 vehicles in a parking lot. There are 25 cars, 5 trucks, and 15 SUVs. How can you use ratio reasoning to make a circle graph to represent this data?
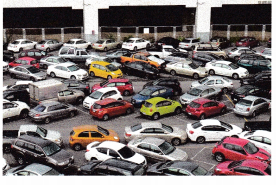
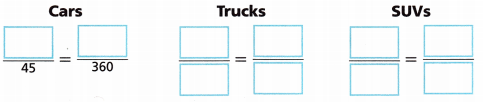
A. Write a part-to-whole ratio to represent the number of each type of vehicle in the parking lot.
Answer:
Number of cars = 25
Number of trucks = 5
Number of SUVs = 15
The ratio of cars, trucks and SUVs = 25:5:5 = 5 : 1 : 3
B. Use your part-to-whole ratios from Part A to find the angle measure for each section in the graph.
Answer:
Cars:
25/45 = x/360
x = 25/45 × 360 = 200
Cars = 200 degrees
Trucks:
5/45 = x/360
5/45 × 360 = x
x = 40
Trucks = 40 degrees
SUVs:
15/45 = x/360
x = 15/45 × 360
x = 120
SUVs = 120 degrees
C. What is the sum of the angle measures you found in Part B? What does this tell you?
_________________
_________________
Answer:
The sum of angle should be equal to 360 degrees
200 + 40 + 120 = 360 degrees
D. Make a circle graph of the parking-lot data. Use a protractor to draw each angle using the angle measures from Part B. Label each section with the type of vehicle it represents.
Answer:
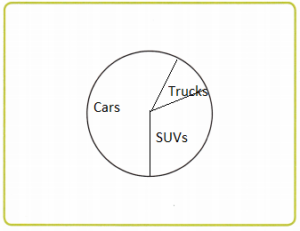
Turn and Talk How does changing the order in which you graph each category affect the circle graph? Explain.
Check Understanding
Question 1.
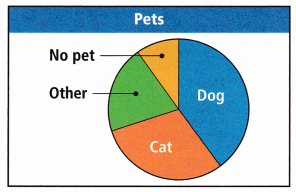
Sara collected information from 60 students in the sixth grade about their pets. She represented the results in a circle graph. How many students own a dog?
_________________
Answer:
Given,
Sara collected information from 60 students in the sixth grade about their pets. She represented the results in a circle graph.
n = 60
Half of the students have cats and other pets = 1/2n
1/2 × 60 = 30 students
Out of 30 5 students does not have pets = 30 – 5 = 25
Thus 25 students have dogs.
Question 2.
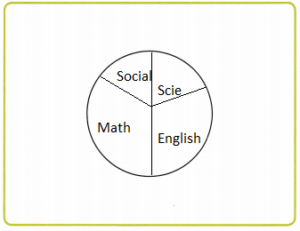
Max conducted a survey of 60 students in which he asked about their favorite school subject. 24 students said math, 12 students said science, 18 students said English, and 6 students said social studies. Max wants to make a circle graph of these data. What angle measure should he use for the English section?
_________________
Answer:
Given,
Max conducted a survey of 60 students in which he asked about their favorite school subject.
24 students said math, 12 students said science, 18 students said English, and 6 students said social studies.
Total = 60
Total angle = 360 degrees
Math = 24 = 24/60 × 360 = 0.4 × 360 = 144 degrees
Science = 12 = 12/60 × 360 = 0.2 × 360 = 72 degrees
English = 18/60 × 360 = 0.3 × 360 = 108 degrees
Social studies = 6/60 × 360 = 0.1 × 360 = 36 degrees
Thus the angle of measures for each section are maths 144 degrees, science 72 degrees, English 108 degrees, Social studies 36 degrees
On Your Own
Question 3.
Use Repeated Reasoning The circle graph shows the preferences of town residents for new playground equipment in a park. If 240 residents responded to the survey, how many residents preferred each type of playground equipment?
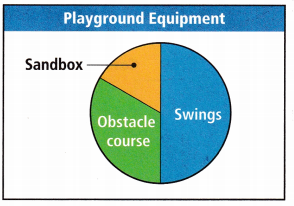
Swings: ____ Sandbox: _____
Obstacle Course: _____
Answer:
The circle graph shows the preferences of town residents for new playground equipment in a park
The circle graph is used to show how variables measure against one another using a circle of different sectors.
Let n = 240
From the given graph we have the following proportions
Sandbox = 1/6n
Obstacle = 1/3n
Swings = 1/2n
Substitute the value of n in the given proportions
Swings = 1/2n = 1/2 × 240 = 120
Swings = 120
Obstacle = 1/3n = 1/3 × 240 = 80
Obstacle = 80
Sandbox = 1/6 × 240 = 40
Sandbox = 40
Thus there are 40 residents in the sandbox, 80 residents in the Obstacle course, and 120 residents in Swings.
Question 4.
Mr. Perez’s science students conducted a wildlife count in the local forest. The results of their count are shown in the table.
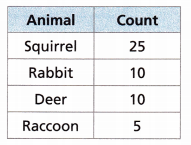
A. Find the angle measure for each section.
________________
Answer:
Total number of animals = 25 + 10 + 10 + 5 = 50
The angle measure of each section is
Angle = Animal × 360/Total
Squirrel = (25 × 360)/50 = 9000/50 = 180
Squirrel = 180
Rabbit = (10 × 360)/50 = 3600/50 = 72
Rabbit = 72
Deer = (10 × 360)/50 = 3600/50 = 72
Deer = 72
Raccoon = (5 × 360)/50
Raccoon = 36
Therefore the angle measure of the section is 180 degrees, 72 degrees, 72 degrees, and 36 degrees.
B. Make a circle graph to represent the data.
Answer:
Question 5.
Daniela listened to a popular radio station for 1 hour. Then she made the circle graph to summarize what she had heard. Complete the table to show the angle measure for each section and the number of minutes that section represents.
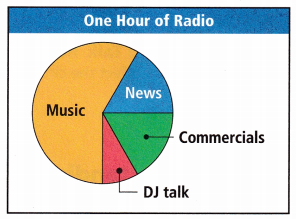
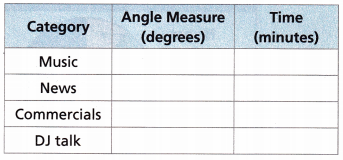
Answer:
I’m in a Learning Mindset!
What challenges do I face in trying to master making a circle graph?
_____________________
Lesson 6.1 More Practice/Homework
Use Ratio Reasoning With Circles
Question 1.
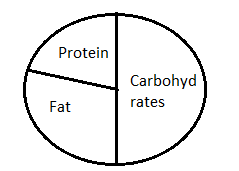
Health and Fitness Kahlil asks his doctor how much of his daily diet should come from carbohydrates, protein, and fat. His doctor recommended 900 calories from carbohydrates, 360 calories from protein, and 540 calories from fat. Kahlil wants to make a circle graph of this information.
A. What is the total number of calories Kahlil should have each day?
________________
Answer:
Given,
Health and Fitness Kahlil asks his doctor how much of his daily diet should come from carbohydrates, protein, and fat. His doctor recommended 900 calories from carbohydrates, 360 calories from protein, and 540 calories from fat.
Total = 900 + 360 + 540 = 1800 calories
B. What are the angle measures for each section?
________________
Answer:
Total number of calories = 1800
Let n = 1800
Carbohydrates = 1/2n
Protein = 1/5n
Fat = 1/3n
Angle measure of carbohydrate is 180 degrees
Angle measure of protein is 80 degrees
Angle measure of fat is 100 degrees
C. Use your answers from Part B to make a circle graph.
________________
Answer:
Question 2.
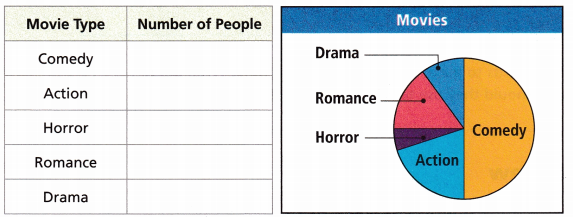
Attend to Precision Sara collected information from students in her school about their favorite type of movie. She represented the results in a circle graph. If 200 students expressed their preference, complete the table below to show how many students picked each type of movie. Use a protractor to find the angle measure of each section.
Answer:
Given,
Sara collected information from students in her school about their favorite type of movie. She represented the results in a circle graph.
Total number of students = 200
n = 200
Comedy = 1/2 n
Action = 1/5n
Horror = 1/20 n
Romance = 1/6n
Drama = 1/12n
Comedy = 1/2 × 200 = 100
Action = 1/5 × 200 = 40
Horror = 1/20 × 200 = 10
Romance = 1/6 × 200 = 33.3
Drama = 1/12 × 200 = 16.6
Thus the angle of each measure is Comedy = 100 degrees, Action = 40 degrees, Horror = 10 degrees, Romance = 33.3 degrees and Drama = 16.6 degrees
Question 3.
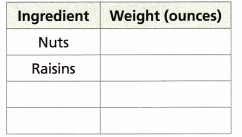
Open Ended Make up your own trail mix recipe.
A. The trail mix will include nuts, raisins, and two ingredients of your choice. Write the ingredients you will use in the first column of the table.
Answer:
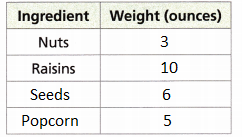
B. Your recipe should make a total of 24 ounces of trail mix. In the second column, record the weight, in ounces, of each ingredient in your recipe.
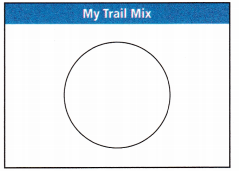
Answer:
C. Make a circle graph to show the portion of the whole recipe each ingredient makes up.
Answer:
Test Prep
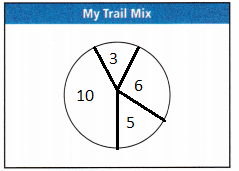
Question 4.
Jon conducted a survey of 180 people in which he asked about their favorite type of exercise. 60 said jogging, 40 said cycling, and 80 said aerobics. Jon wants to make a circle graph of these data. What angle measure should he use for the aerobics section?
A. 80°
B. 120°
C. 160°
D. 240°
Answer: 120°
Explanation:
Jon conducted a survey of 180 people in which he asked about their favorite type of exercise.
60 said jogging, 40 said cycling, and 80 said aerobics.
Option B is the correct answer.
Question 5.
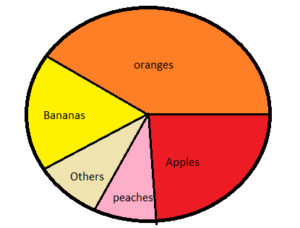
Ms. Hager’s math class kept a record of the fruit sold in the school cafeteria over the course of a week. The results are shown in the table.
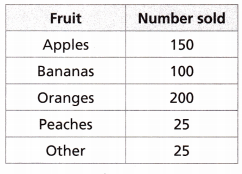
A. Write the ratio of oranges sold to total pieces of fruit sold.
_____________________
Answer:
Number of apples sold = 150
Number of bananas sold = 100
Number of oranges sold = 200
Number of peaches sold = 25
Number of other fruits sold = 25
Total = 500
The ratio of oranges sold to total pieces of fruit sold = 200:500 = 2:5
B. The class wants to make a circle graph of the data. What angle measure should they use to represent the oranges section?
_____________________
Answer:
Spiral Review
Question 6.
Bob buys some apples for $16.50. If Bob buys 4.4 pounds of apples, what is the price per pound?
_____________________
Answer:
Given,
Bob buys 4.4 pounds of apples for $16.50
16.50 ÷ 4.4 = $3.75
The price of apples per pound is $3.75
Question 7.
Sara wants to make dinner for herself. The recipe she will use calls for 13\(\frac{1}{2}\) ounces of chopped nuts. However, the recipe feeds 6 people. How many ounces of chopped nuts does Sara need for one serving?
________________
Answer:
Given,
Sara wants to make dinner for herself. The recipe she will use calls for 13\(\frac{1}{2}\) ounces of chopped nuts.
The recipe feeds 6 people.
13\(\frac{1}{2}\) ÷ 6
Convert from mixed fraction to the improper fraction.
13\(\frac{1}{2}\) = \(\frac{27}{2}\)
\(\frac{27}{2}\) ÷ 6
\(\frac{27}{2}\) × \(\frac{1}{6}\)
\(\frac{9}{2}\) × \(\frac{1}{2}\) = \(\frac{9}{4}\)
Now convert from improper fraction to the mixed fraction.
\(\frac{9}{4}\) can be written as 2 \(\frac{1}{4}\) = 2.25
Question 8.
How many inches are in 8 feet? ________________
Answer:
Convert from feet to inches.
1 feet = 12 inches
8 feet = x
x × 1 = 12 × 8
x = 96
Thus there are 96 inches in 8 feet.