We included HMH Into Math Grade 6 Answer Key PDF Module 16 Lesson 3 Find Mean Absolute Deviation to make students experts in learning maths.
HMH Into Math Grade 6 Module 16 Lesson 3 Answer Key Find Mean Absolute Deviation
I Can find the mean absolute deviation of a data set.
Spark Your Learning
Gillian has taken 5 tests worth 100 points each. Her scores are shown. What score does she need on her next test to have an average of 90? Explain.
88 85 89 92 90

Answer:
She needs to score 96 on her next test.
Explanation:
To find the average we need to add the numbers and then divide by the no of terms.
Let us assume x as the 6th test score
(88 + 85 + 89 + 92 + 90 + x) ÷ 6 = 90
(444 + x) ÷ 6 = 90
444 + x = (90 × 6)
444 + x = 540
x = 540 – 444
x = 96
Hence Gillian needs to score 96 on her next test.
Turn and Talk If the maximum score on any test is 100, is it possible for Gillian to raise her test average to 93 with her sixth test? Explain.
Answer:
Yes, It is possible to raise her average to 93.
Explanation:
(88 + 85 + 89 + 92 + 90 + x) ÷ 6 = 93
(444 + x) ÷ 6 = 93
444 + x = 93 × 6
444 + x = 553
x = 553 – 444
x = 109
Build Understanding
Question 1.
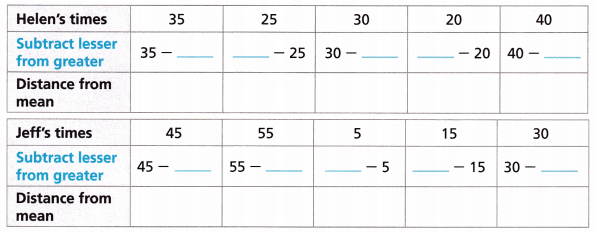
Helen and Jeff record the time, in minutes, they spent practicing piano this week.

A. What is the mean for each set of data?
Answer:
Mean for each set of data is 30.
Explanation:
Given data set for Helen
35 25 30 20 40
Sum of terms = 35 + 25 + 30 + 20 + 40
= 150
No of values = 5
Mean = sum of terms ÷ no of values
= 150 ÷ 5
= 30
Data set for Jeff
45 55 5 15 30
Sum of terms = 45 + 55 + 5 + 15 + 30
= 150
No of values = 5
Mean for Jeff = 150 ÷ 5
= 30
B. The mean helps you to describe a set of data by identifying the center of the data. What do you notice about the means from Part A? Will they help you to distinguish between the two sets of data?
Answer:
The mean between the two sets of data is same.
C. You can use another statistical measure to compare two data sets. The mean absolute deviation, or MAD, will help you to quantify how spread out each data set is and help you compare them. Begin by finding the distance from the mean to each data value for each data set. Use the means you found in Part A.
Connect to Vocabulary
Answer:
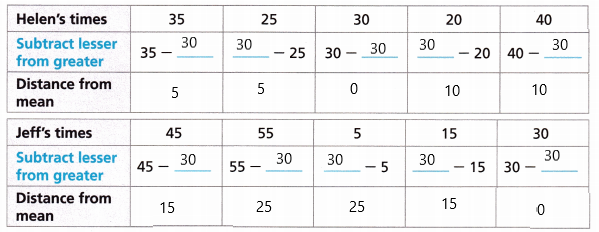
D. Find the mean absolute deviation for each data set by finding the mean of the distances in Part C.
Answer:
MAD = 6 for Helen
MAD = 16 for Jeff
Explanation:
Distance from mean for helen’s times is
5, 5, 0, 10, 10
Total = 5 + 5 + 0 + 10 + 10 = 30
No of vlaues = 5
MAD = 30 ÷ 5
= 6
Distance from mean for Jeff’s time
15, 25, 25, 15, 0
Total value = 15 + 25 + 25 + 15 = 80
No of values = 5
MAD = Total values ÷ no of values
= 80 ÷ 5
= 16
E. Which data set has a greater mean absolute deviation? What does this tell you about the data?
Answer:
The data set for Jeff has greater MAD than the Helen.
Step It Out
Question 2.
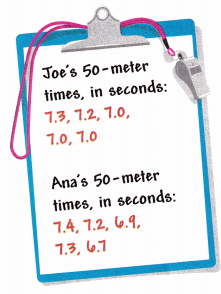
Ana and Joe record their times running the 50-meter dash. Find the mean absolute deviation for each sprinter’s times. Who is the more consistent sprinter?
A. Find the mean time, in seconds, for each sprinter.
Answer:
The mean for Joe’s = 7.1 and Ana’s 50 – meter mean is 7.1
Explanation:
Given the data set for Joe’s 50 – meter times, in seconds
7.3, 7.2, 7, 7, 7
Sum of terms = 7.3 + 7.2 + 7 + 7 + 7
= 35.5
No of terms = 5
Mean = Sum of terms ÷ no of terms
= 35.5 ÷ 5
= 7.1
Ana’s 50 -meter times, in seconds
Given data 7.4, 7.2, 6.9, 7.3, 6.7
Sum of terms = 35.5
No of terms = 5
Mean = Sum of terms ÷ No of terms
= 35.5 ÷ 5
= 7.1
B. Find the distance from the mean to each data value for each data set.
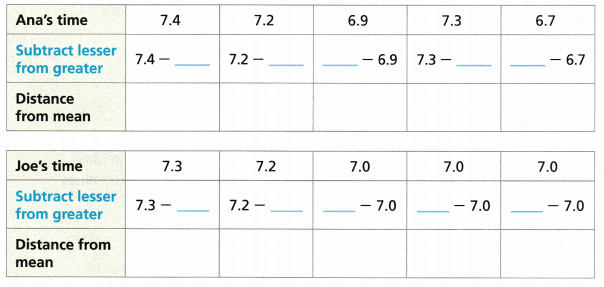
Answer:
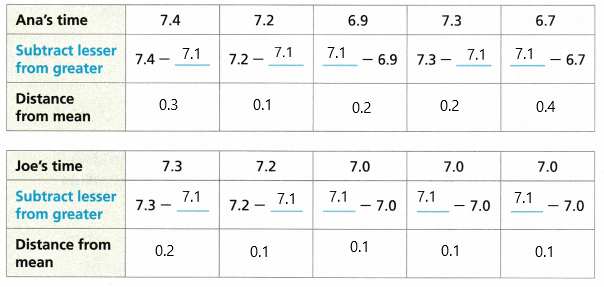
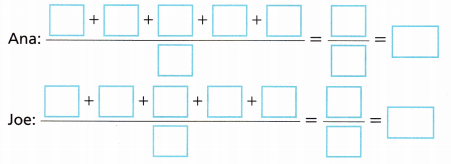
C. Find the mean absolute deviation for each data set.
Answer:
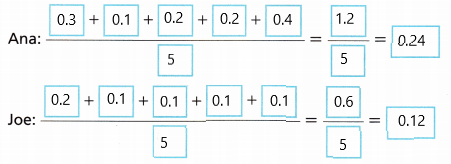
D. Which data set has a greater mean absolute deviation? What does this tell you about the data? Who is the more consistent sprinter?
Answer:
The data set for Ana’s 50 meter time has a greater mean absolute deviation. Ana is more consistent sprinter than Joe.
Turn and Talk In Part C, why was it necessary to find the mean of the distances? Explain.
Answer:
The mean of the distance is necessary to calculate the value of mean absolute deviation.
The mean absolute deviation (MAD) tells you the average distance of data points from the mean. The data points whose distances to the mean are less than or equal to the MAD are within the mean absolute deviation.
Question 3.
Aaron surveyed the people in his apartment building to find out how many computers they owned. The mean of his data is 3 computers. The mean absolute deviation is 1.4. Find the values that fall within the MAD and the values that fall outside the MAD.
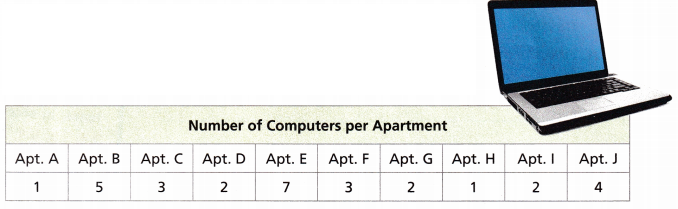
A. Find the distance from the mean number of computers, 3, to each data value.
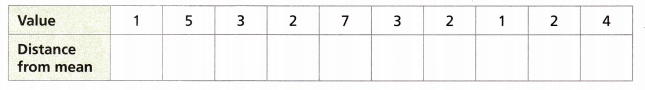
Answer:
Given data set is
1, 5, 3, 2, 7, 3, 2, 1, 2 and 4
Sum of values = 1 + 5 + 3 + 2 + 7 + 3 + 2 + 1 + 2 + 4
= 30
No of values = 10
Mean = Sum of values ÷ no of values
= 30 ÷ 10
= 3
MAD = 1.4
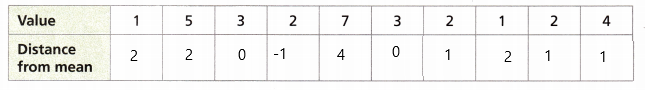
B. If a data value’s distance from the mean is less than or equal to the MAD of 1.4, then the value is within the mean absolute deviation. Which values from Aaron’s survey fall within the mean absolute deviation?
Answer:
C. If a data value’s distance from the mean is greater than the MAD of 1.4, then the value is outside the mean absolute deviation. Which values from Aaron’s survey fall outside the mean absolute deviation?
Answer:
D. Another way to find the values that fall within the MAD is to add and subtract the MAD from the mean. This gives you the greatest and least values within the MAD. All values between the numbers will be within the MAD. For Aaron’s data, find this range around the mean.
mean + MAD = 3 + ![]() =
= ![]()
mean – MAD = 3 – ![]() =
= ![]()
Values from __________ to ____________ are within the MAD.
Answer:
mean + MAD = 3 + 1.4
= 4.4
Mean – MAD = 3 – 1.4
= 1.6
Values from 5 to 4 are within the MAD.
Check Understanding
For Problems 1-2, find the mean and the mean absolute deviation of each data set. Circle the data that falls within the mean absolute deviation.
Question 1.
5 8 10 12 15 25 11 7 30 17
Mean = ___________
MAD = ____________
Answer:
Mean = 14, MAD = 6.4
Explanation:
Given,
The data set is 5 8 10 12 15 25 11 7 30 17
Sum of terms = 5 + 8 + 10 + 12 + 15 + 25 + 11 + 7+ 30 + 17
= 140
No of terms = 10
Mean = 140 ÷ 10
= 14
5 – 14 = |-11| = 11
8 – 14 = |-6| = 6
10 – 14 = |-4| = 4
12 – 14 = |-2| = 2
15 – 14 = |-1| = 1
25 – 14 = |-11| = 11
11 – 14 = |-3| = 3
7 – 14 = |-7| = 7
30 – 14 = |16| = 16
17 – 14 = |3| = 3
11 + 6 + 4 + 2 + 1 + 11 + 3 + 7 + 16 + 3 = 64
64 ÷ 10 = 6.4
MAD = 6.4
Question 2.
9.5 10.5 11.25 10.75 9.25
Mean = ___________
MAD = ____________
Answer:
Mean = 10.25, MAD = 2.6
Explanation:
The given data set 9.5 10.5 11.25 10.75 9.25
sum of terms = 51.25
No of terms = 5
Mean = 51.25 ÷ 5 = 10.25
9.5 – 10.25 = |-0.75| = 0.75
10.5 – 10.25 = |0.25| = 0.25
11.25 – 10.25 = |1| = 1
10.75 – 10.25 = |10.25| = 10.25
9.25 – 10.25 = |-0.75| = 0.75
0.75 + 0.25 + 1 + 10.25 + 0.75 = 13
No of terms = 13
MAD = 13 ÷ 5
= 2.6
On Your Own
Question 3.
The table shows the numbers of hours two friends spent swimming laps each week. Which data set is more spread out?
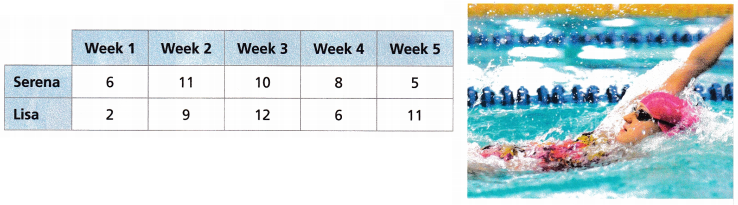
A. Find the mean for each data set.
Answer:|
Mean for data set Serena = 8
Mean for data set Lisa = 8
Explanation:
Given data
For Serena 6, 11, 10, 8, 5
6 + 11 + 10 + 8 + 5 = 40
Mean = sum of terms ÷ no of terms
= 40 ÷ 5
= 8
For Lisa 2, 9, 12, 6, 11
2 + 9 + 12 + 6 + 11 = 40
= 40 ÷ 5
= 8
B. Find the distance from the mean for each data value.
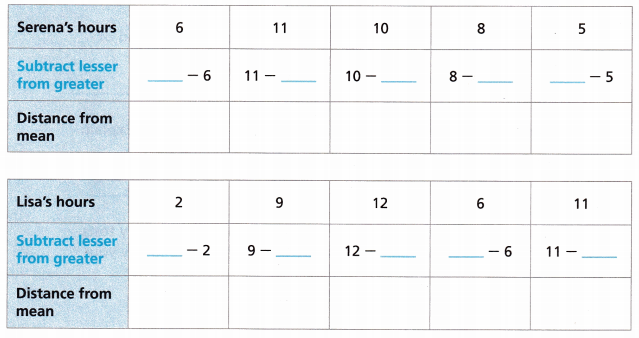
Answer:
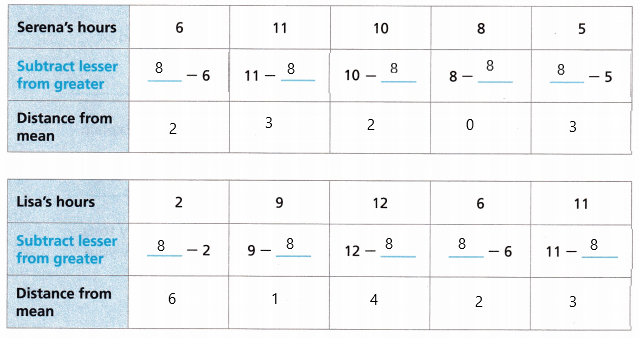
C. Attend to Precision Calculate the MAD for both sets of data.
Answer:
MAD For Serena is 2.
MAD for Lisa is 3.
Explanation:
Distance from mean for Serena’s hour is
2 , 3, 2, 0, 3
Sum of the distance form mean = 2 + 3 + 2 + 0 + 3
= 10
No of values = 5
MAD = Sum of terms ÷ no of values
= 10 ÷ 5
= 2
Distance from Mean for Lisa’s hours
Sum of terms = 6 + 1 + 4 + 2 + 3
= 15
No of values = 5
MAD = 15 ÷ 5
= 3
D. The data set for ___________ is more spread out, because the mean absolute deviation is ___________.
Answer:
The data set for Lisa is more spread out, because the mean absolute deviation is greater fpr
Question 4.
Ramon is a pumpkin farmer. Each year he records the number of the pumpkins he sold for 5 weeks. The mean is 782 pumpkins and the mean absolute deviation is 52. List two possible values that are within the mean absolute deviation.
Answer:
789, 801
Explanation:
The values that are within the mean absolute deviation are all the values in the interval:
[M – S, M + S]
M = 782, S = 52
782 – 52, 782 + 52
730, 834
Then any number between 730 and 834 are 789, 801.
Question 5.
A group of people is being trained to standardize the scoring of diving competitions. The same dive was judged by 10 different trainees at the beginning and at the end of their training. The results are shown.
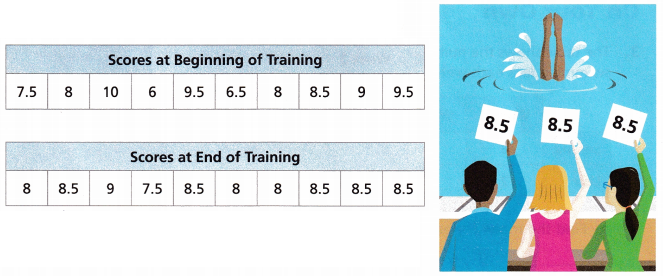
A. Calculate the mean absolute deviation for the scores at the beginning of training.
Answer:
The mean absolute deviation is 1.025.
Explanation:
Given the scores at Beginning of the Training
7.5, 8, 10, 6, 9.5, 6.5, 8, 8.5, 9, 9.5
Calculate the mean
7.5 + 8 + 10 + 6 + 9.5 + 6.5 + 8 + 8.5 + 9 + 9.5 = 82.5
No of terms = 10
Mean = 82.5 ÷ 10
= 8.25
7.5 – 8.25 = |-0.75| = 0.75
8 – 8.25 = |-0.25| = 0.25
10 – 8.25 = |1.75| = 1.75
6 – 8.25 = |-2.25| = 2.25
9.5 – 8.25 = |1.25| = 1.25
6.5 – 8. 25 = |-1.75| = 1.75
8 – 8.25 = |-0.25| = 0.25
9 – 8.25 = |0.75| = 0.75
9.5 – 8.25 = |1.25| = 1.25
0.75 + 0.25 + 1.75 + 2.25 + 1.25 + 1.75 + 0.25 + 0.75 + 1.25 = 10.25
10.25 ÷ 10 = 1.025
B. Calculate the mean absolute deviation for the scores at the end of training.
Answer:
Mean absolute deviation = 0.34
Explanation:
Given scores at End of training
8, 8.5, 9, 7.5, 8.5, 8, 8, 8.5, 8.5, 8.5
calculate the mean
8 + 8.5 + 9 + 7.5 + 8.5 + 8 + 8 + 8.5 + 8.5 + 8.5 = 83
No of terms = 83 ÷ 10
= 8.3
Now calculate the mean absolute deviation
8 – 8.3 = |-0.3| = 0.3
8.5 – 8.3 = |0.2| = 0.2
9 – 8.3 = |0.7| = 0.7
7.5 – 8.3 = |-0.8| = 0.8
8.5 – 8.3 = |0.2| = 0.2
8 – 8.3 = |-0.3| = 0.3
8 – 8.3 = |-0.3| = 0.3
8.5 – 8.3 = |0.2| = 0.2
8.5 – 8.3 = |0.2| = 0.2
8.5 – 8.3 = |0.2| = 0.2
0.3 + 0.2 + 0.7 + 0.8 + 0. 2 + 0.3 + 0.3 + 0.2 + 0.2 + 0.2 = 3.4
Mean absolute deviation = 3.4 ÷ 10 = 0.34
C. Did the trainees make progress in standardizing their scores? Explain.
Answer:
Yes, the trainees make progress in standardizing their scores.
Because the mean for the scores at End of Training is lower than the scores at Beginning of training.
Question 6.
Reason Two students had the following scores on five history tests. Which set of scores shows more variation? Use the MADs to justify your answer.
Student A: 82, 90, 87, 91, 97
Student B: 84, 91, 89, 95, 91
Answer:
The set of scores for student A shows more variation than the scores of Student A.
Given data of student A is 82, 90, 87, 91, 97
Sum of values = 82 + 90 + 87 + 91 + 97
= 447
No of values = 5
Mean = 447 ÷ 5
= 89.4
Now find the distance between mean
82 – 89.4 = |-7.4| = 7.4
90 – 89.4 = |0.6| = 0.6
87 – 89.4 = |-2.4| = 2.4
91 – 89.4 = |1.6| = 1.6
97 – 89.4 = |7.6| = 7.6
Total distance between mean = 7.4 + 0.6 + 2.4 + 1.6 + 7.6
= 19.8
No of values = 5
MAD = Total distance between mean ÷ no of values
= 19.8 ÷ 5
= 3.96
Now data value for student B
Student B: 84, 91, 89, 95, 91
Sum of student B = 450
No of values = 5
Mean = 450 ÷ 5
= 90
Now the distance between mean
84 – 90 = |-6| = 6
91 – 90 = |-1| = 1
89 – 90 = |-1| = 1
95 – 90 = |5| = 5
91 – 90 = |1| = 1
Total = 6 + 1 + 1 + 5 + 1= 14
No of values = 5
MAD = 14 ÷ 5
= 2.8
I’m in a Learning Mindset!
How did I apply prior knowledge to find the mean absolute value of a data set?
Answer:
The difference between each data and mean is called mean absolute value of a data set.
|data value – mean|
Lesson 16.3 More Practice/Homework
Question 1.
STEM A laboratory is studying brown anole lizards, which are native to Cuba and the Bahamas but are an invasive species in the southern U.S.A. from Florida to Texas. The length of 10 male lizards caught by researchers in Texas is shown in the table.
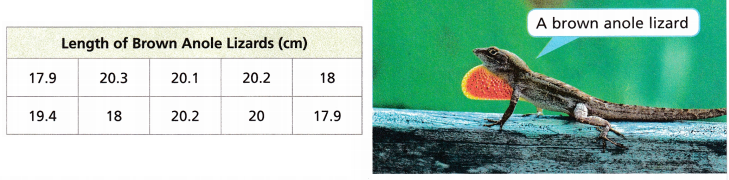
Calculate the mean of the lengths of the lizards. Then calculate the mean absolute deviation.
Answer:
Mean =19.2 and Mean absolute deviation is 0.566.
Explanation:
Given the data for length of brown Anole Lizards
Mean = sum of the values ÷ no of values
Given data set is 17.9, 20.3, 20.1, 20.2, 18, 19.4, 18, 20.2, 20, 17.9
Sum of the values = 17.9 + 20.3 + 20.1 + 18 + 19.4 + 18 + 20.2 + 20 + 17.9
= 192
No of values = 10
Mean = 192 ÷ 10
= 19.2
Find the distance between the mean
17.9 – 19.2 = |-1.3| = 1.3
20.3 – 19.2 = |1.1| = 1.1
20.1 – 19.2 = |0.9| = 0.9
18 – 19.2 = |-1.2| = 1.2
19.4 – 19.2 = |0.2| = 0.2
18 – 19.2 = |-1.2| = 1.2
202 – 19.2 = |0.96| = 0.96
Total mean = 1.3 + 1.1 + 0.9 + 1.2 + 0.2 + 1.2 + 0.96
= 5.66
MAD = 5.66 ÷ 10
= 0.566
Question 2.
Math on the Spot Professor Burger ran the 50-yard dash four times and recorded his times in seconds as 6.8, 5.9, 6.2, and 6.7. What is the mean absolute deviation of Professor Burger’s times?
Answer:
The mean absolute deviation of Professor Burger’s times is 0.35
Explanation:
Given data set is 6.8, 5.9, 6.2, 6.7
Mean for the data set = (6.8 + 5.9 + 6.2 + 6.7)
= 25.6 ÷ 4
= 6.4
No find the distance between the mean
6.8 – 6.4 = |0.4|
5.9 – 6.4 =|-0.5|
6.2 – 6.4 = |0.2|
6.7 – 6.4 = |0.3|
total mean = 0.4 + 0.5 + 0.2 + 0.3
= 1.4
MAD = 1.4 ÷ 4
= 0.35
Question 3.
Several 2-pound bags of yellow onions at the supermarket are measured to see how much they actually weigh. Their weights are 2.1, 1.9, 2.3, 2.0, 2.4, 1.8, 2.1, and 2.2 pounds. What are the mean and the mean absolute deviation of the weights?
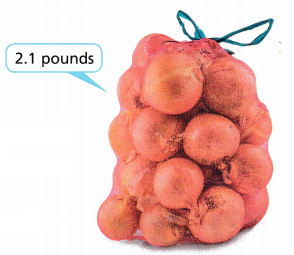
Answer:
2.1
Explanation:
Given weights are 2.1, 1.9, 2.3, 2.0, 2.4, 1.8, 2.1, and 2.2 pounds.
2.1 + 1.9 + 2.3 + 2 + 2.4 + 1.8 + 2.1 + 2.2 = 16.8
16.8 ÷ 8
= 2.1
Question 4.
The mean of a data set is 9.4 and the mean absolute deviation is 1.2. List three data points that are within the MAD.
Answer:
Given Mean of data set is 9.4 and MAD = 1.2
[M – S, M + S]
9.4 – 1.2 , 9.4 + 1.2
8.2 , 10.6
Question 5.
The mean of a data set is 4.5 and the mean absolute deviation is 0.8. Find the range around the mean that describes the values which fall within the mean absolute deviation.
Answer:
Given
Mean of a dara set = 4.5
MAD = 0.8
4.5 – 0. 8, 4.5 + 0.8
3.7, 5.3.
Test Prep
Question 6.
The prices of muesli cereal at different stores are shown in the table.
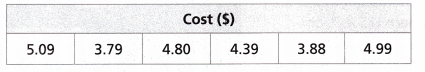
A. What is the mean price?
Answer:
Mean = 4.49
Explanation:
Given, The prices of muesli cereal are 5.09, 3.79, 4.80, 4.39, 3.88, and 4.99
Sum of terms = 5.09 + 3.79 + 4.80 + 4.39 + 3.88 + 4.99
= 26.94
No of the terms are 5
Mean = sum of terms ÷ no of terms
= 26.94 ÷ 5
= 4.49
B. What is the mean absolute deviation of the prices?
Answer:
Mean absolute deviation is 0.56
Explanation:
Given mean = 4.49
5.09 – 4. 49 = |0.6| = 0.6
3.79 – 4.49 = |-0.7| = 0.7
4.80 – 4.49 =|0.31| = 0.3
4.39 – 4.49 = |-0.1| = 0.1
3.88 – 4.49 = |-0.61| = 0.6
4.99 – 4.49 = |0.5| = 0.5
0.6 + 0.7 + 0.3 + 0.1 + 0.6 + 0.5 = 2.8
2.8 ÷ 5 = 0.56
Question 7.
The mean of a set of data is 4.03 and the mean absolute deviation is 2.69. Which data points are within the mean absolute deviation? Select all that apply.
(A) 1.3
(B) 2.3
(C) 3.5
(D) 4.6
(E) 5.8
(F) 6.7
(G) 7.5
(H) 8.6
Answer:
2.3, 5.8, 3.5, 4.6, and 6.7 are the data points that are within the mean absolute deviation.
Question 8.
Which of the following is closest to the mean absolute deviation of the data set: 2,1, 3.5, 4.6, 5.8, 3.9, 4.2, 2.8?
(A) 0.89
(B) 1.6
(C) 3.84
(D) 3.9
Answer:
0.89
Explanation:
The number 0.89 is closest to the mean absolute deviation of the data set.
Spiral Review
Question 9.
What is the volume of a rectangular prism that is 3\(\frac{1}{2}\) inches wide, 5\(\frac{1}{2}\) inches long, and 9 inches high?
Answer:
The volume of the rectangular prism is l × b × h
l = 3\(\frac{1}{2}\) inches = \(\frac{7}{2}\) inches
w = 5\(\frac{1}{2}\) inches = \(\frac{11}{2}\) inches
|and h = 9 inches.
Volume = \(\frac{7}{2}\) × \(\frac{11}{2}\) × 9
= 693 ÷ 4
= 173.25 cubic inches.
Question 10.
Tyler collects data about how many animal companions (dogs, cats, birds, etc.) live at each house in his neighborhood. The number at each house is 1, 0, 2, 3, 2, 4, 12, 1, 2, and 6. Find the mean, median, and mode. What measure of center best describes the typical number of animal companions per household in his neighborhood? Explain.
Answer:
The mean is 3.3, the Median is 2 and the Mode is 2.
Explanation:
Given,
The number at each house is 1, 0, 2, 3, 2, 4, 12, 1, 2, and 6.
Sum of terms = 1 + 0 + 2 + 3 + 2 + 4 + 12 + 1 + 2 + 6
= 33
No of terms = 10
Mean = Sum of terms ÷ No of terms
= 33 ÷ 10
= 3.3
Let us arrange the given number of terms in ascending to descending order
0, 1, 1, 2, 2, 2, 3, 4, 6, 12
The Median is the middle value of the data set.
The middle half of the value is 2
Hence median is 2.
Mode is called the value that occurs often in the given data set.
Hence 2 is called the mode.