We included HMH Into Math Grade 6 Answer Key PDF Module 16 Lesson 2 Display Data in Box Plots to make students experts in learning maths.
HMH Into Math Grade 6 Module 16 Lesson 2 Answer Key Display Data in Box Plots
I Can draw and interpret box plots.
Spark Your Learning
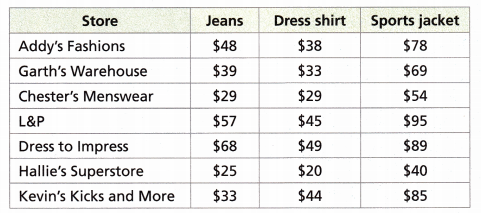
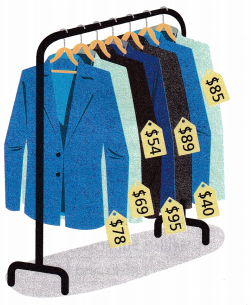
Slavik is looking to buy new clothes for his best friend’s weekend-long celebration. He wants to get the most for his money. He has gone to 7 stores and made a list of the prices for jeans, dress shirts, and sports jackets. He has $160 to spend. He needs to buy 1 of each item. What combination of items best fits his budget?

Answer:
The store Garth’s Warehouse with Jeans, Dress shirt and Sports jacket best fits.
Turn and Talk Why might it be better for Slavik to buy clothes that cost more, instead of buying all of his clothes at Hallie’s Superstore?
Answer:
At Halle’s superstore
The jeans cost $25, the Dress shorts cost $20 and the Sports jacket $40 for a total of $85.
He has $160 to spend. So it might be better for Slavik to buy clothes that cost more.
Build Understanding
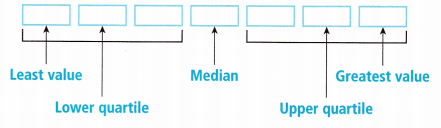
A box plot is a graph that shows how data are distributed by using the median, quartiles, least value and greatest value.
Connect to Vocabulary
The lower quartile is the median of the lower half of the data.
The upper quartile is the median of the upper half of the data.
Question 1.
Consider the prices for sports jackets that Slavik found: $78, $69, $54, $95, $89, $40, $85. Find the median, the lower quartile, and the upper quartile of the prices.
A. Explain how to find the median, then find the median.
Answer:
Given,
$78, $69, $54, $95, $89, $40, $85.
Arrange them in order
$40, $54, $69, $78, $85 $89 and $95
Sum of terms to calculate mean is $40 + $54 + $69 + $78 + $85 + $89 + $95
= $510
No of values are = 7
Mean = Sum of terms ÷ No of values
= 510 ÷ 7
= 72.8
Median is the middle value of the data set = $78
lower quartile is the lower value of the data = $40
Upper quartile is the upper value of the data = $95
B. The lower quartile is the median of the lower half of the data or data to the left of the median. What is the lower half of the data? What is the lower quartile?
Answer:
The lower half of the data is $40, $54, and $69 and the lower quartile is the median of the lower data.
Lower quartile = $54.
C. The upper quartile is the median of the upper half of the data or data to the right of the median. What is the upper half of the data? What is the upper quartile?
Answer:
The upper half of the data is $85 $89 and $95.
the upper quartile is $89.
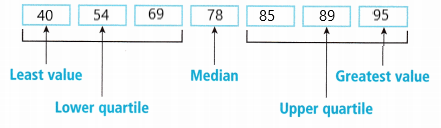
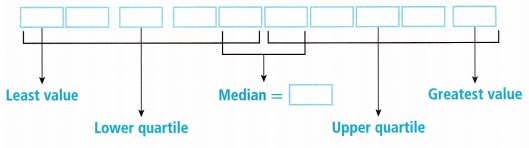
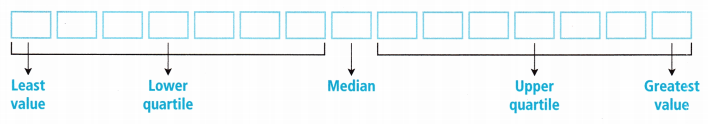
D. You can do Parts A to C by using the following display. Fill in the boxes with the prices in order from least to greatest.
Answer:
E. So, the median is ![]() , the lower quartile is
, the lower quartile is ![]() , and the upper quartile is
, and the upper quartile is ![]() .
.
Answer:
E. So, the median is $78, the lower quartile is $54, and the upper quartile is $89.
Turn and Talk How would this process change if the data set had 8 values?
Answer:
Step It Out
A box plot uses boxes to show how the values in a data set are distributed, or spread out. It shows the data set divided into quarters, based on the quartiles and median.

Question 2.
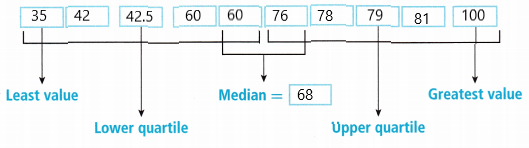
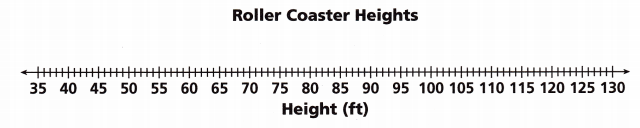
The heights in feet of 10 roller coasters are 76, 35, 60, 42.5, 81, 79, 60, 78, 42, and 100. Make a box plot of this data.
A. Find the median, the lower and upper quartiles, the least value, and the greatest value. Start by ordering the data.
Answer:
76, 35, 60, 42.5, 81, 79, 60, 78, 42, and 100
35, 42, 42.5, 60, 60, 76, 78, 79, 81, 100
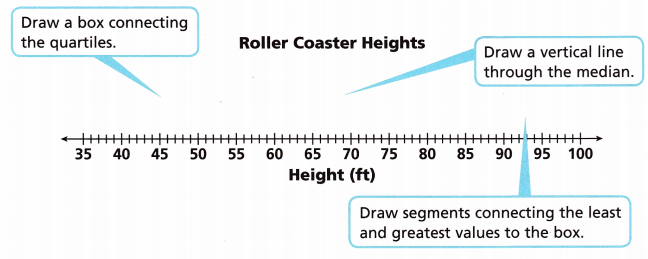
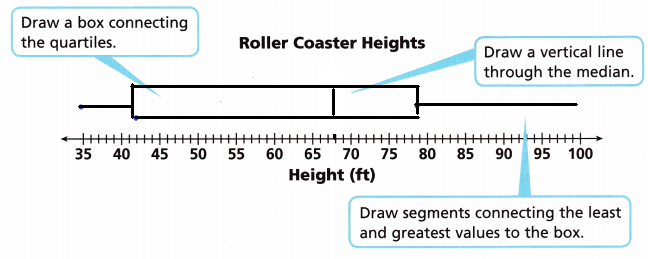
B. Draw the box plot above the number line. Start by putting dots above the least value, the lower quartile, the median, the upper quartile, and the greatest value. Then draw the box connecting the quartiles.
Answer:
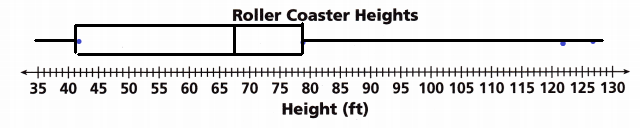
C. If the heights 122 feet and 127 feet were added to the data, how would the box plot change? Draw a new box plot to show the changes.
Answer:
Question 3.
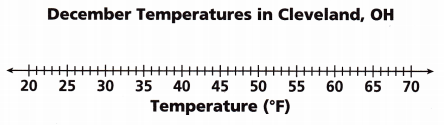
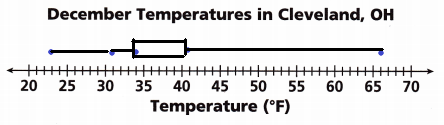
The daily high temperatures for Cleveland, Ohio, for 15 days in December are: 66, 57, 56, 41, 34, 32, 35, 31, 34, 28, 23, 34, 30, 37, and 39 degrees Fahrenheit. Make a box plot to display the data.

A. Find the median, the lower and upper quartiles, the least value, and the greatest value. Start by ordering the data.
Answer:
Given data set
66, 57, 56, 41, 34, 32, 35, 31, 34, 28, 23, 34, 30, 37, and 39
23, 28, 30, 31, 32, 34, 34, 34 35, 37, 39, 41, 56, 57, 66.
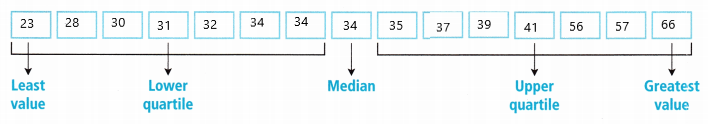
B. On the number line, draw dots above the least value, the lower quartile, the median, the upper quartile, and the greatest value. Then draw a box and lines to complete the box plot.
Answer:
Check Understanding
Question 1.
The prices of a quart of soy milk at different stores are as listed: $2.99, $3.29, $3.09, $3.79, $3.59, $3.39, $3.59, $3.89, $3.19, $3.49, $3.69, and $3.29. Find the median, lower quartile, and upper quartile of the data.
Answer:
Median = $3.44, lower Quartile = $3.14 and upper quartile = $3.74
Explanation:
Given tthe prices of a quart of soy milk at different stores are as listed: $2.99, $3.29, $3.09, $3.79, $3.59, $3.39, $3.59, $3.89, $3.19, $3.49, $3.69, and $3.29.
First let us arrange the data det in ascending order
$2.99, $3.09, $3.19, $3.29, $3.29, $3.39, $3.49, $3.59, $3.59, $3.69, $3.79, $3.89
Median is the middle value of the data set
Median = ($3.39 + $ 3.49) ÷ 2
= 6.88 ÷ 2
= $3.44
The lower quartile is called the median of the lower half of the data.
($3.09 + $3.19) ÷ 2
= 6.28 ÷ 2
= $3.14
The upper quartile is called the median of the higher half of the data.
($3.69 + $3.79) ÷ 2
= $7.48 ÷ 2
= $3.74
Question 2.
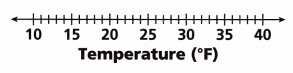
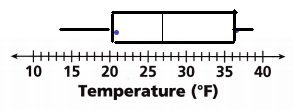
The daily low temperature in degrees Fahrenheit for a week in Denver, Colorado, were 37, 14, 23, 21, 27, 39, and 34. Make a box plot of the data.
Answer:
Given data is 37, 14, 23, 21, 27, 39, and 34
Arrange them in order
14, 21, 23, 27, 34, 37, 39
Now draw a box plot
Question 3.
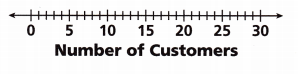
The number of customers who entered a store each hour was recorded one Saturday: 5, 9, 15, 23, 27, 20, 16, 12, 14, and 18. Make a box plot of the data.
Answer:
Given data is
5, 9, 15, 23, 27, 20, 16, 12, 14, and 18.
Arrange them in order
5, 9, 12, 14, 15, 16, 18, 20, 23, 27
Median = (15 + 16) ÷ 2
= 15.5
Lower quartile = (9 + 12) ÷ 2
= 10.5
Upper quartile = (20 + 23) ÷ 2
= 21.5
On Your Own
Question 4.
Geography The heights (to the nearest foot) of coastal redwood trees over 340 feet tall are given below.
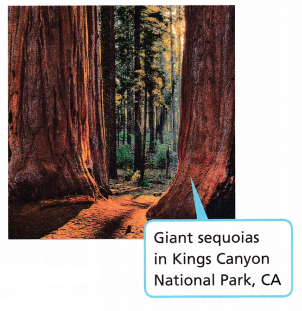
359, 361, 363, 358, 368, 361, 366, 360,
358, 359, 358, 366, 363, 364, 358, 363
A. Order the numbers from least to greatest.
Answer:
The numbers from least to greatest is
358, 358, 358, 358, 359, 359, 360, 361, 361, 363, 363, 363, 364, 366, 366, 368
B. Find the median, lower quartile and upper quartile of the data set.
Median: _________ Lower quartile: ___________ Upper quartile: ____________
Answer:
Median = 361, lower quartile = 358.5 and upper quartile = 363.5
Explanation:
Given data set is
358, 358, 358, 358, 359, 359, 360, 361, 361, 363, 363, 363, 364, 366, 366, 368
Median is (361 + 361) ÷ 2
= 361
Lower quartile is (358 + 359) ÷ 2
717 ÷ 2
= 358.5
Upper quartile is (363 + 364) ÷ 2
= 727 ÷ 2
= 363.5
Question 5.
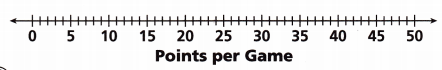
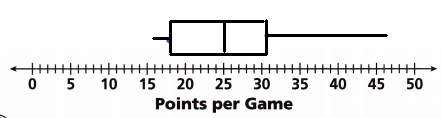
The number of points a basketball player scored in each game this season so far are 16, 26, 23, 32, 19, 36, 18, 25, 30, 23, 47, 30, 16, 25, and 19.
A. Find the median, lower quartile, and upper quartile of the data set.
Answer:
Median = 2, upper quartile = 31 and upper quartile = 27.5
Explanation:
Given data set are
16, 26, 23, 32, 19, 36, 18, 25, 30, 23, 47, 30, 16, 25, and 19.
Arrange them in order
16, 16, 18, 19, 19, 23, 23, 25, 25, 26, 30, 30, 32, 36, 47
Median = 25
Lower quartile = (18 + 19) ÷ 2
= 18.5
Upper quartile = (30 + 32) ÷ 2
31
B. Make a box plot for the data set.
Answer:
Question 6.
Use Structure Describe the box plot using the lowest value, the quartiles, median, and the greatest value. What does the width of the box say about the data?
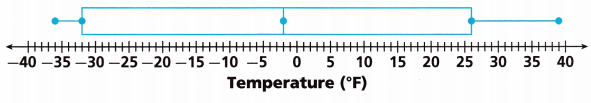
Answer:
Median = -2
Lowest value = -36
Greatest value = 39
For Problems 7-8, find the median, lower quartile, and upper quartile of the data.
Question 7.
27, 21, 24, 21, 26, 16, 24, 31, 0, 23
Answer:
Median = 23.5
lower quartile = 21
Upper Quartile = 26
Explanation:
Given the data set
27, 21, 24, 21, 26, 16, 24, 31, 0, 23
Arrange them in order
0, 16, 21, 21, 23, 24, 24, 26, 27, 31
The median is the middle value of the given data set
23 + 24 = 47
Median = 47 ÷ 2
= 23.5
Lower quartile: The lower quartile is the median of the lower half of the data
lower quartile = 21
Upper quartile: The upper quartile is the median of the upper half of the data.
Upper Quartile = 26
Question 8.
4.9, 6.4, 3.6, 6.4, 4.6, 6.4, 4.2, 7.4
Answer:
Given data is 4.9, 6.4, 3.6, 6.4, 4.6, 6.4, 4.2, 7.4
Arrange them in ascending to descending order
3.6, 4.2, 4.6, 4.9, 6.4, 6.4, 6.4, 7.4
Median = (4.9 + 6.4) ÷ 2
= 11.3 ÷ 2
= 5.65
Lower quartile is (4.2 + 4.6) ÷ 2
= 4.4
Upper quartile is (6.4 + 6.4) ÷ 2
12.8 ÷ 2
6.4
Question 9.
Andre likes to read a book in bed before he goes to sleep each night. For two weeks, he noted how many pages he read each night. He read 8, 12, 13, 6, 4, 19, 25, 7, 3, 18, 11, 15, 6, and 4 pages. Find the median, lower quartile, and upper quartile of the data set. Then make a box plot for the data set.

Answer:
Given data set is 8, 12, 13, 6, 4, 19, 25, 7, 3, 18, 11, 15, 6, and 4 pages
Arrange them in order
3, 4, 4, 6, 6, 7, 8, 11, 12, 13, 15, 18, 19, 25,
Median = (8 + 11) ÷ 2
= 19 ÷ 2
= 9.5
Lower quartile = 6
Upper quartile = 15
Question 10.
Attend to Precision How can you find the median, lower quartile, and upper quartiles of a data set with 16 values? Explain.
Answer:
The Median is called the middle half of the value for the data set
The data set has 16 values.
The values are even number
So to find the Median = (n9 + n10) ÷ 2
Lower quartile = (n + 1) ÷ 2
Upper quartile = (n + 1) ÷ 2
Question 11.
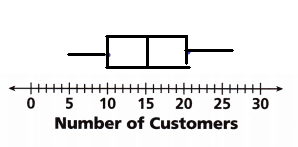
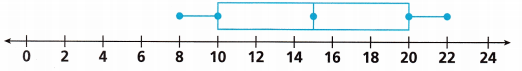
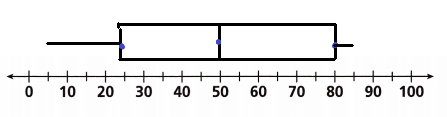
Open-Ended Describe a situation that could be represented by the box plot shown.
Answer:
Given the data plot
Median = 15,
Lower value = 8
Upper value = 22
Lower quartile range = 10
The upper quartile is 20
Question 12.
Make a box plot for the data set.
Answer:
I’m in a Learning Mindset!
What steps did I take to find the upper and lower quartiles in Problem 5?
Answer:
Lesson 16.2 More Practice/Homework
Question 1.
Henry has taken a survey of the hourly wages of employees at a bakery. His results are shown. Find the median, lower quartile, and upper quartile of the data.
Answer:
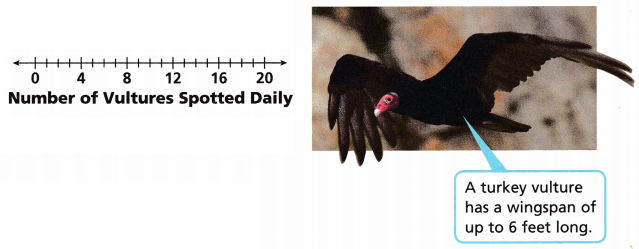
Question 2.
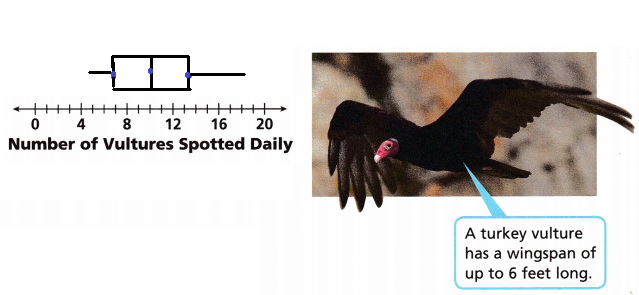
STEM A biologist is studying turkey vultures in Everglades National Park. Turkey vultures are one of the two vulture species native to the United States. The number of vultures the biologist spotted each day are 6, 9, 13, 8, 5, 12, 7, 18, 10, 14, 10 and 15. Make a box plot for the data set.
Answer:
Given data set
6, 9, 13, 8, 5, 12, 7, 18, 10, 14, 10 and 15
5, 6, 7, 8, 9, 10, 10, 12, 13, 14, 15, 18
Median = (10 + 10) ÷ 2
= 20 ÷ 2
= 10
Lower quartile = (7 + 8) ÷ 2
= 7.5
Upper quartile = (13 + 14) ÷ 2
13.5
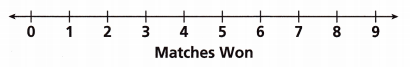
Question 3.
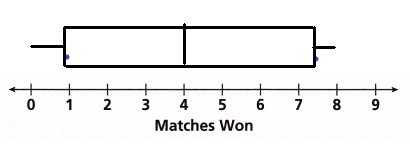
Math on the Spot The number of matches won by a ping-pong team during each of the last 11 seasons are 7, 6, 8, 4, 0, 4, 8, 2, 3, 0, and 6. Use the data to make a box plot.
Answer:
Given data set
7, 6, 8, 4, 0, 4, 8, 2, 3, 0, and 6.
0, 0, 2, 3, 4, 4, 6, 6, 7, 8, 8,
Median = 4
Lower quartile = (0 + 2) ÷ 2
= 1
Upper quartile = (7 + 8) ÷ 2
= 15 ÷ 2
= 7.5
For Problems 4-5, find the median, lower quartile, and upper quartile of the data.
Question 4.
5, 18, 7, 10, 14, 9, 2, 11, 13, 25, 16
Answer:
Median = 11
Lower quartile = 7
Upper quartile = 11
Explanation:
Given data set
5, 18, 7, 10, 14, 9, 2, 11, 13, 25, 16
Arrange them in ascending to descending order.
2, 5, 7, 9, 10, 11, 13, 14, 16, 18, 25
Sum of the given terms = 130
No of terms = 11
Mean = Sum of terms ÷ no of terms
= 130 ÷ 11
11.8
The Median is called the middle value of the data set
The median is 11
Lower quartile = 7
Upper quartile = 11
Question 5.
35, 28, 17, 60, 41, 36, 44, 55, 39, 50, 48, 19
Answer:
Median = 40
Lower quartile = 28
Upper Quartile = 50
Explanation:
Given data set
35, 28, 17, 60, 41, 36, 44, 55, 39, 50, 48, 19
Arrange them in order
17, 19, 28, 35, 36, 39, 41, 44, 48, 50, 55, 60
The median is called the middle value of the data set.
Median is (39 + 41) ÷ 2
= 40
Lower quartile = 28
Upper Quartile = 50
Question 6.
Make a box plot for the data set.
25, 35, 5, 15, 85, 75, 65, 55, 45, 35, 25, 65, 75, 85
Answer:
Given data set
25, 35, 5, 15, 85, 75, 65, 55, 45, 35, 25, 65, 75, 85
5, 15, 25, 25, 35, 35, 45, 55, 65, 65, 75, 75, 85, 85
Median = (45 + 55) ÷ 2
50
Lower quartile = (25 + 25) ÷ 2
= 25
Upper quartile = (75 + 85) ÷ 2
= 80
Test Prep
Question 7.
A softball team scored the following number of runs in the games they have played so far this year: 8, 5, 6, 9, 3, 1, 0, 4, 12, 14, 3, and 5. What are the lower and upper quartiles of this data?
(A) lower quartile = 1;
upper quartile = 8.5
(B) lower quartile = 1;
upper quartile = 12
(C) lower quartile = 3;
upper quartile = 8.5
(D) lower quartile = 3;
upper quartile = 12
Answer:
Option D
lower quartile = 3;
upper quartile = 12
Explanation:
Given data is 8, 5, 6, 9, 3, 1, 0, 4, 12, 14, 3, and 5
Arrange them in ascending to descending order.
0, 1, 3, 3, 4, 5, 5, 6, 8, 9, 12, 14
The lower quartile is 3 and upper quartile us 12.
Question 8.
Emile records the time he spends making dinner each night for 8 nights. What is the lower quartile of his data?
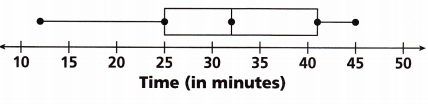
Answer:
The given data is 12, 25, 32, 42 and 45
Hence the lower quartile of the given data is 25.
Question 9.
What are the lowest and highest values on this box plot?
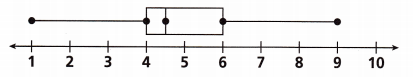
(A) lowest value: 1
highest value: 6
(B) B lowest value: 4
highest value: 9
(C) lowest value: 4
highest value: 6
(D) lowest value: 1
highest value: 9
Answer:
(D) lowest value: 1
highest value: 9
Answer:
Option D
lowest value: 1
highest value: 9
Explanation:
The lowest value on this box plot is 1 and the highest value on the dot plot is 9.
Spiral Review
Question 10.
Which of the following questions is a statistical question? Explain.
- How old is Mary’s father?
- What time does school start at Lincoln Elementary?
- What color is the principal’s desk at King Middle School?
- How did your classmates get to school today?
Answer:
How did your classmates get to school today?
Explanation:
How old is Mary’s father?
The question given is not a statistical question because it has only one answer and it’s not a collection of quantitative data.
What time does school start at Lincoln Elementary? is also not a statistical question.
What color is the principal’s desk at King Middle School?
is also not a statistical question.
How did your classmates get to school today?
The given question is a statistical question because the classmates can get to school with various means and not just one means. And we can get the data from the given question.
Question 11.
The number of hours Louisa worked each week over the summer were 19, 23, 18, 25, 16, 17, 21, 48, 20, and 13. Which measure of center best describes the data: mean, median, or mode?
Answer:
Given data is 19, 23, 18, 25, 16, 17, 21, 48, 20, and 13.
Let us arrange the data in ascending to descending order.
13, 16, 17, 18, 19, 20, 21, 23, 25, 48
Mean = 13 + 16 + 17 + 18 + 19 +20 + 21+ 23 + 25 + 48 = 220
Mean = 220 ÷ 10 = 22
Median = (19 + 20) ÷ 2
= 39 ÷ 2
= 19.5
Mode = 13, 16, 17, 18, 19, 20, 21, 23, 25, 48