We included HMH Into Math Grade 6 Answer Key PDF Module 14 Lesson 3 Make Histograms and Frequency Tables to make students experts in learning maths.
HMH Into Math Grade 6 Module 14 Lesson 3 Answer Key Make Histograms and Frequency Tables
I Can determine an appropriate interval for the data and construct a frequency table or histogram.
Step It Out
When there is a large number of data values, it is helpful to group data into intervals. A histogram is a way to show the frequency of numeric data.
Connect to Vocabulary
A histogram is a bar graph whose bars represent the frequencies of numeric data within equal intervals.
Question 1.
A tae kwon do school teaches many ages of students. The ages of the students are shown in the histogram.
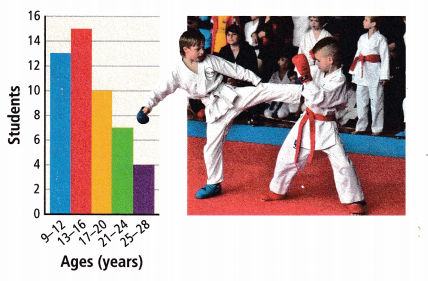
A. The height of each bar represents the __________ in each age group.
Answer: The height of each bar represents the age of students in each age group.
B. You can find the total number of students that were included in the data set by finding the __________ of each bar and ___________ those values together.
Answer:
You can find the total number of students that were included in the data set by finding the frequency of each bar and total number of data values those values together.
C. There are ___________ students in the range from 25 to 28 years old.
Answer: By seeing the above histogram we can say that there are 4 students in the range from 25 to 28 years old.
D. There are ___________ students ages 9-16 years old.
Answer: By seeing the above histogram we can say that there are 30 students ages 9-16 years old.
E. The age range of __________ years old has the greatest number of students.
Answer: The age range of 13 – 16 years old has the greatest number of students.
F. The difference between the number of students in the 13-16 year age range and the number of students in the 17-20 year age range is __________ students.
Answer:
The difference between the number of students in the 13-16 year age range and the number of students in the 17-20 year age range is
13 – 16 = 15
17 – 20 = 10
15 – 10 = 5
The difference between the number of students in the 13-16 year age range and the number of students in the 17-20 year age range is 5 students.
Turn and Talk Can you make a dot plot from a histogram? Explain.
Answer:
A frequency table is used to organize data.
Connect to Vocabulary
A frequency table lists items together according to the number of times or frequency, that the items occur.
Question 2.
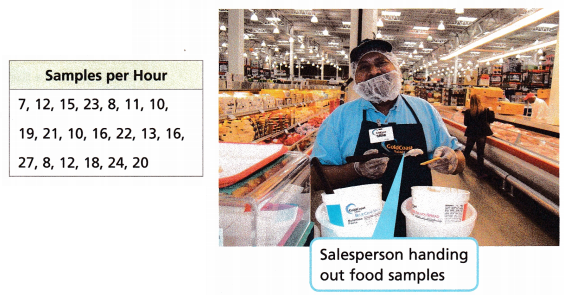
A salesperson hands out samples during work. The number of samples handed out each hour during the work week are tracked. Make a frequency table to represent the data.
A. Write the data in order from least to greatest.
Answer:
Given data,
7, 12, 15, 23, 8, 11, 10, 19, 21, 10, 16, 22, 13, 16, 27, 8, 12, 18, 24, 20
Arranging the data from least to greatest
7, 8, 8, 10, 10, 11, 12, 12, 13, 15, 16, 16, 18, 19, 20, 21, 22, 23, 24, 27
B. The numbers vary from __________ to _________, so use a scale from 1 to 30.
Answer: 7 to 27.
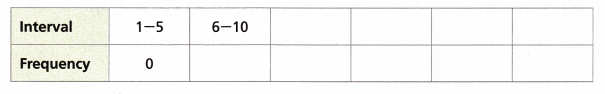
C. Divide the data into six equal-sized intervals.
The first interval is 1 – ![]() .
.
The second interval is ![]() –
– ![]() .
.
The third interval is ![]() –
– ![]() .
.
The fourth interval is ![]() –
– ![]() .
.
The fifth interval is ![]() –
– ![]() .
.
The sixth interval is ![]() –
– ![]() .
.
Answer:
The first interval is 1 – 5.
The second interval is 6 – 10.
The third interval is 11 – 15.
The fourth interval is 16 – 20.
The fifth interval is 21 – 25.
The sixth interval is 25 – 30.
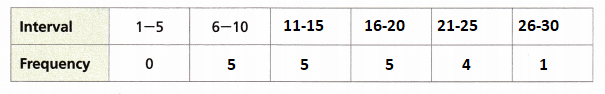
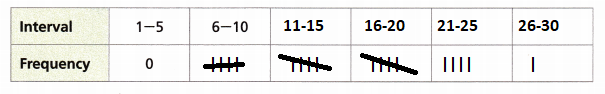
D. Complete the frequency table.
Answer:
7, 8, 8, 10, 10, 11, 12, 12, 13, 15, 16, 16, 18, 19, 20, 21, 22, 23, 24, 27
6 – 10 = 5
11 – 15 = 5
16 – 20 = 5
21-25 = 4
26 – 30 = 1
Turn and Talk What is another way you could display the data from the frequency table?
Answer: Another way to display the data from the frequency table is as follows
Question 3.
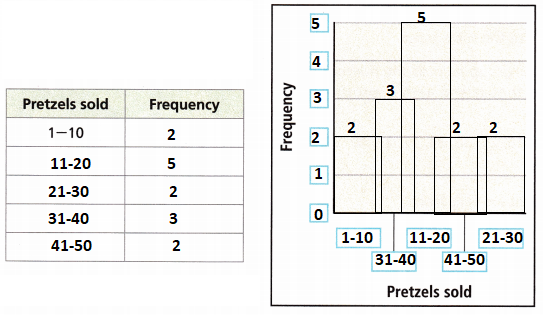
A movie theater records the number of pretzels it sells per day for 2 weeks. The pretzel sales data are shown in the list. Make a histogram to represent the data.
11, 8, 21, 15, 28, 43, 37, 9, 12, 13, 17, 31, 50, 34
A. Order the data from least to greatest.
Answer:
Given data,
11, 8, 21, 15, 28, 43, 37, 9, 12, 13, 17, 31, 50, 34
Arranging the data from least to greatest
8, 9, 11, 12, 13, 15, 17, 21, 28, 31, 34, 37, 42, 50
B. The numbers vary from ___________ to _________, so use a scale from 1 to 50.
Answer: 8 to 50
C. Divide the data into five equal-sized intervals.
The first interval is 1 – 10.
The second interval is ![]() –
– ![]() .
.
The third interval is ![]() –
– ![]() .
.
The fourth interval is ![]() –
– ![]() .
.
The fifth interval is ![]() –
– ![]() .
.
Answer:
The first interval is 1 – 10.
The second interval is 11 – 20.
The third interval is 21 – 30.
The fourth interval is 31 – 40.
The fifth interval is 41 – 50
D. Complete the frequency table.
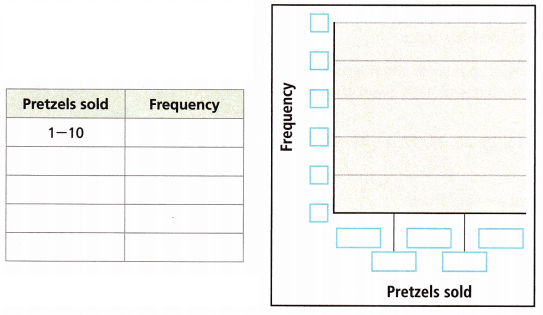
Answer:
The first interval is 1 – 10 and the frequency is 2.
The second interval is 11 – 20 and the frequency is 5.
The third interval is 21 – 30 and the frequency is 2.
The fourth interval is 31 – 40 and the frequency is 3.
The fifth interval is 41 – 50 and the frequency is 2.
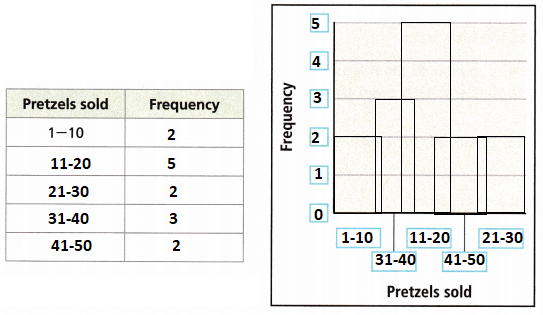
E. Fill in the values in the histogram.
Answer:
Check Understanding
Question 1.
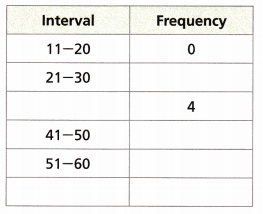
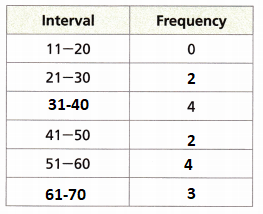
A restaurant records the numbers of people who come in for breakfast for 15 days. Use the data to complete the frequency table.
38, 59, 61, 33, 48, 54, 67, 29, 35, 49, 53, 21, 40, 66, 55
Answer:
Given data,
A restaurant records the numbers of people who come in for breakfast for 15 days.
38, 59, 61, 33, 48, 54, 67, 29, 35, 49, 53, 21, 40, 66, 55
11-20 = 0
21-30 = 2
31-40 = 4
41-50 = 2
51-60 = 4
61-70 = 3
Question 2.
Describe how the histogram in Task 3 would look if the intervals were 0 – 20, 21 – 40, and 41 – 60.
Answer:
On Your Own
Question 3.
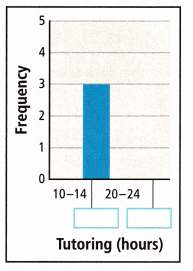
Jimena tutored students over the summer. She recorded the number of hours she tutored each week. Here are her data:
15, 24, 18, 26, 18, 21, 23, 12, 24, 25
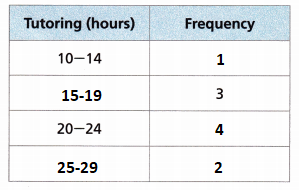
A. Complete the frequency table.
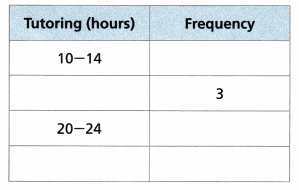
Answer:
Given data,
15, 24, 18, 26, 18, 21, 23, 12, 24, 25
Arrange from least to greatest
12, 15, 18, 18, 21, 23, 24, 24, 25, 26
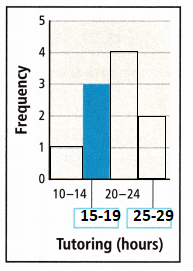
B. Complete the histogram.
Answer:
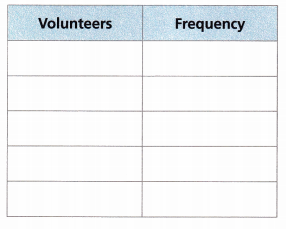
Question 4.
A volunteer group records the number of volunteers that attend each event they host, as shown.
19, 30, 27, 16, 25, 38, 24, 17, 22, 40, 39, 26, 18, 37, 16

A. The numbers vary from ________ to __________, so use a scale from 16 to 40.
Answer:
Given data,
19, 30, 27, 16, 25, 38, 24, 17, 22, 40, 39, 26, 18, 37, 16
Arrange from least to greatest
16, 16, 17, 18, 19, 22, 24, 25, 26, 27, 30, 37, 38, 39, 40
The numbers vary from 16 to 40, so use a scale from 16 to 40.
B. Complete the frequency table to divide the data into 5 equal-sized intervals.
First interval: 16 – ![]()
Second interval: ![]() –
– ![]()
Third interval: ![]() –
– ![]()
Fourth interval: ![]() –
– ![]()
Fifth interval: ![]() –
– ![]()
Answer:
First interval: 16 – 20
Second interval: 21 – 25
Third interval: 25 – 30
Fourth interval: 31 – 35
Fifth interval: 36 – 40
C. Complete the frequency table.
Answer:
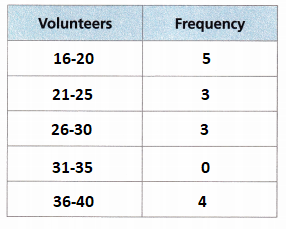
D. Use Structure If you drew a histogram for this data, which interval would have the shortest bar? ________________
Answer: 31-35 intervals would have the shortest bar.
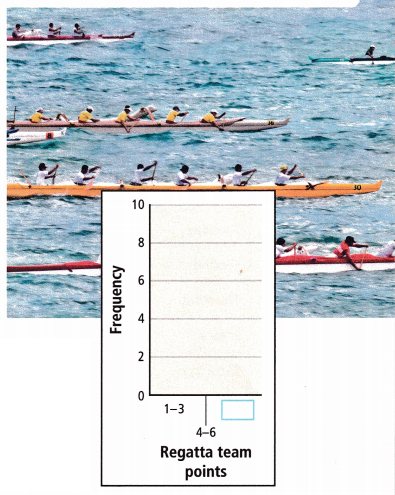
Question 5.
Each team in a Hawaiian canoe racing regatta gains points for its finish times. The points each team earned are shown.
2, 6, 7, 5, 3, 4, 1, 8, 2, 9, 8, 6, 3, 5, 2, 4, 6
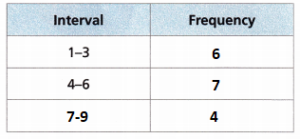
A. Use the data to complete the frequency table.
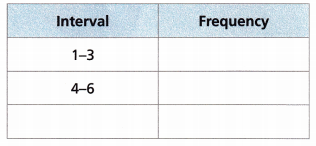
Answer:
Given data,
2, 6, 7, 5, 3, 4, 1, 8, 2, 9, 8, 6, 3, 5, 2, 4, 6
Arranging the data from least to greatest.
1, 2, 2, 2, 3, 3, 4, 4, 5, 5, 6, 6, 6, 7, 8, 8, 9
B. How many bars will be used to represent the intervals in a histogram of the team points?
Answer: 3 bars will be used to represent the intervals in a histogram of the team points.
C. What is the height of the tallest bar in the histogram?
Answer: 4-6 is the height of the tallest bar in the histogram
D. Complete the histogram.
Answer:
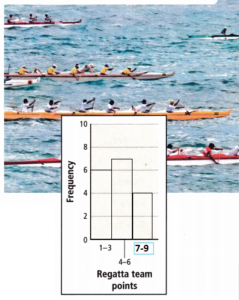
E. Reason Three other teams that competed were accidentally not included in the list. They earned 3, 2, and 8 points. How does this new information change the histogram? Is the second interval still the tallest bar? Explain.
Answer:
The actual tallest bar is 7 with intervals 4-6.
If they have earned 8 points then the second interval will not be the tallest bar.
Question 6.
In the high jump, athletes run and jump over a bar without knocking it down. The histogram shows the heights of the jumps of the top athletes in a state competition.
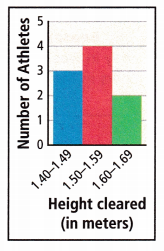
A. Which height range did the most athletes clear?
Answer: 2 to 4 is the height range of the jumps of the top athletes in a state competition.
B. How many athletes participated in the state competition?
Answer: 3 + 4 + 2 = 9
9 athletes participated in the state competition.
Question 7.
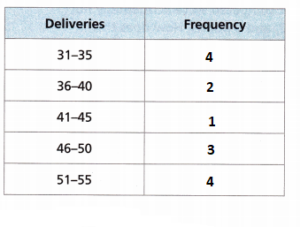
A florist delivers flowers each day. The table shows the numbers of flower deliveries for a two-week period.
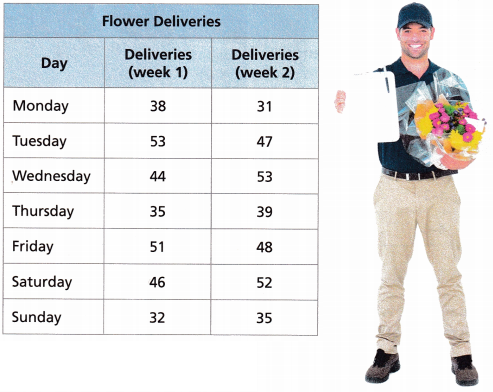
A. Use the data from the table of delivery information to complete the frequency table.
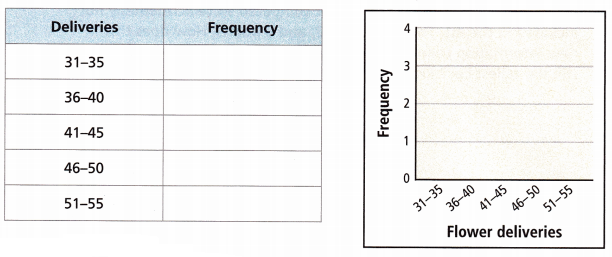
Answer:
B. Complete the histogram.
Answer:
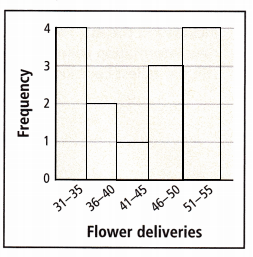
C. Reason If the florist makes the same number of deliveries each day in weeks 3 and 4 as in weeks 1 and 2, how does this change the bars in the histogram? Explain.
Answer:
Lesson 14.3 More Practice/Homework
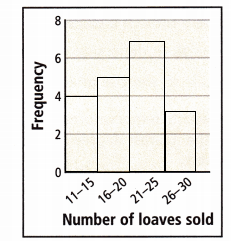
Question 1.
A bakery records the number of loaves of bread it sells per hour for one day as shown.
15, 17, 20, 22, 23, 25, 11, 12, 26, 13, 18, 21, 24, 28, 23, 18, 29, 24, 16
A. Write the data in order from least to greatest.
Answer:
Given data,
15, 17, 20, 22, 23, 25, 11, 12, 26, 13, 18, 21, 24, 28, 23, 18, 29, 24, 16
Arranging the data from least to greatest.
11, 12, 13, 15, 16, 17, 18, 18, 20, 21, 22, 23, 23, 24, 24, 25, 26, 28, 29
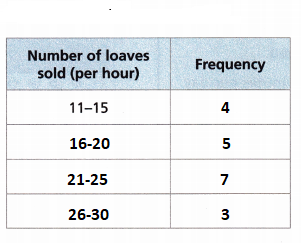
B. Complete the frequency table.
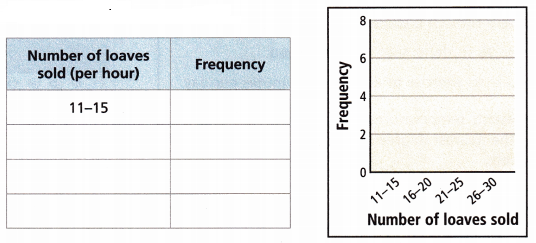
Answer:
C. Complete the histogram.
Answer:
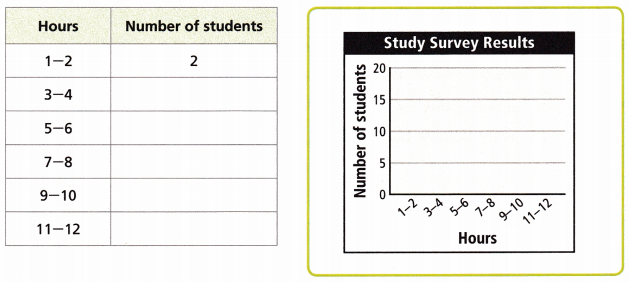
Question 2.
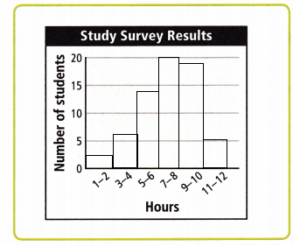
Math on the Spot The table shows survey results about the number of hours a week students spend studying. Make a histogram of the data.
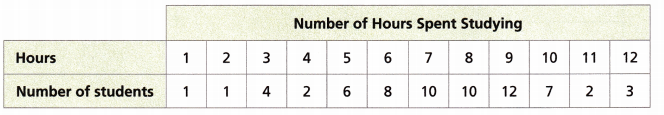
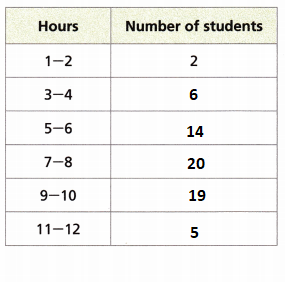
A. Make a frequency table of the data.
Answer:
Given data,
1, 1, 4, 2, 6, 8, 10, 10, 12, 7, 2, 3
Arrange from least to greatest.
1, 1, 2, 2, 3, 4, 6, 7, 8, 10, 10, 12
B. Draw a bar for each interval from the frequency table.
Answer:
Test Prep
Question 3.
The histogram shows the amounts of time students spend exercising per day, rounded to the nearest hour. Which statements about the histogram are correct? Select all that apply.
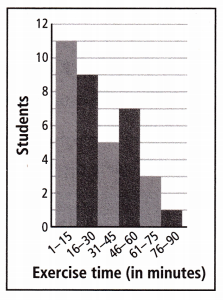
(A) The least common amount of time spent exercising was 76-90 minutes.
(B) The most common exercise times are 1-15 minutes.
(C) There are a total of 6 students that exercise.
(D) There are 36 students that were surveyed.
(E) Most students exercise more than 60 minutes per day.
Answer:
(A) The least common amount of time spent exercising was 76-90 minutes.
(B) The most common exercise times are 1-15 minutes.
A and B are the correct answers.
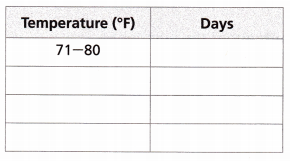
Question 4.
The list represents temperatures for the month of June, rounded to the nearest degree Fahrenheit. Complete the frequency table.
93, 85, 97, 79, 104, 88, 92, 94, 97, 87, 78, 95, 101, 93, 97, 99, 87, 103, 90, 95, 102, 97, 99, 91, 95, 92, 101, 89, 99, 98
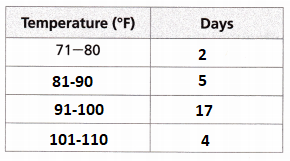
Answer:
Given data,
93, 85, 97, 79, 104, 88, 92, 94, 97, 87, 78, 95, 101, 93, 97, 99, 87, 103, 90, 95, 102, 97, 99, 91, 95, 92, 101, 89, 99, 98
71 – 80 = 2
81 – 90 = 5
91 – 100 = 17
101 – 110 = 4
Spiral Review
Question 5.
Gustus bought three pairs of shoes. Each pair costs $19.98. What is the total amount he spent on shoes, before tax?
Answer:
Given that,
Gustus bought three pairs of shoes. Each pair costs $19.98.
3 × $19.98 = $59.94
Thus the total amount he spends on shoes is $59.94
Question 6.
A car travels 220 miles in 4 hours. If the car travels at the same speed, how far will it have traveled after 6 hours?
Answer:
Given,
A car travels 220 miles in 4 hours.
Distance = 220 miles
Time = 4 hrs
So , Speed = d/t = 220/4 = 55 miles/h
55 × 6 = 330 miles
Question 7.
A bucket can hold a total of 5 gallons of water. If the bucket is 45% full, how much water is in the bucket?
Answer:
Given,
A bucket can hold a total of 5 gallons of water.
If the bucket is 45% full,
5 × 0.45 = 2.25
Thus if the bucket is 45% full 2.25 gallons of water is in the bucket.