We included HMH Into Math Grade 6 Answer Key PDF Module 14 Lesson 1 Explore Statistical Data Collection to make students experts in learning maths.
HMH Into Math Grade 6 Module 14 Lesson 1 Answer Key Explore Statistical Data Collection
I Can identify statistical questions, describe the nature of attributes under investigation, and report the number of observations.
Spark Your Learning
Rani measured the heights of the seedlings she is growing.
The heights were \(\frac{3}{4}\) inch, \(\frac{7}{8}\) inch, \(\frac{1}{2}\) inch, \(\frac{3}{4}\) inch, \(\frac{5}{8}\) inch, \(\frac{3}{4}\) inch, \(\frac{7}{8}\) inch, \(\frac{5}{8}\) inch, \(\frac{1}{2}\) inch, \(\frac{3}{4}\) inch, \(\frac{1}{2}\) inch, and \(\frac{1}{2}\) inch. How can Rani organize the information to present it to her science class?

Answer:
Turn and Talk What are some other ways you could describe or organize the information shown in the list, such as by least height?
Answer:
Build Understanding
When you measure the heights of your classmates, you are collecting data.
“What are the heights of my classmates?” is a statistical question, because height usually varies within a group of people. The data set will have multiple values, such as 54 inches, 48 inches, 51 inches, and so on. Statistical questions require multiple measurements in order to describe data sets, that can be both numeric and non-numeric quantities.
“What is Zoya’s height?” is not a statistical question because it asks for only one piece of information. The data set will only have a single value, such as 54 inches.
Connect to Vocabulary
Data is a set of information collected about people or things, often to draw conclusions about them.
A statistical question is a question that has many different, or variable answers.
Question 1.
Read the question shown.
“How many hours do sixth-grade students typically spend on homework each week?”
A. Could this question yield a variety of different answers? Explain.
Answer:
This question has a different variety of answers.
For each week they study a different number of hours.
B. Is this a statistical question? Explain how you know.
Answer:
Yes, it is a statistical question. Because it has different collecting data and there is variability in the data.
Question 2.
Read the question shown.
“How many siblings does Deion have?”
A. Could this question yield a variety of different answers? Explain.
Answer:
How many siblings does Deion have means for example Deion has 2 siblings or 3 siblings is an answer.
so, it is not a statistical question. Because it is answered with a single data point and it has no variability.
B. Is this a statistical question? Explain how you know.
Answer:
It is not a statistical question. Because it is answered with a single data point and it has no variability.
Turn and Talk Is the question “How much does Alvin’s cat weigh?” a statistical question? Explain. If it is not a statistical question, how can you change it to make it a statistical question?
Answer:
How much Alvin’s cat weigh is not a statistical question. Because it is answered with a single data point and it has no variability.
By changing this question into how much the Alvins cat weight grows each day of a week. it is a statistical question.
One way to describe a set of data is by stating the number of observations, or measurements, that were made. Another method of describing data is to list the attributes or characteristics that were measured, such as color or length.
Question 3.
The table shows the results for some female runners in one semifinal heat of the 100-meter hurdles at the 2016 Summer Olympics.
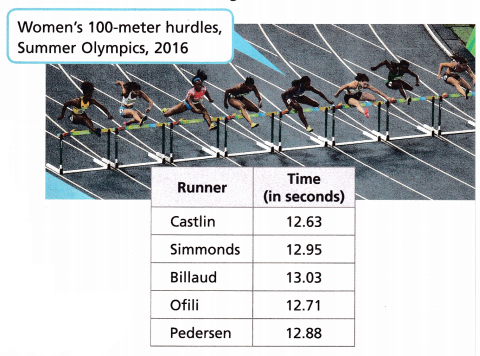
A. What attribute is being measured by the data in the table?
Answer:
The attribute Runner is measured by the data in the table.
B. What is the unit of measurement for the data?
Answer:
The units of the data are the seconds.
C. To what fraction of a second are the results given?
Answer:
1 minute = 60 seconds
The given data is in seconds.
For a minute fraction of a second are the results given
D. How do you think the data was measured?
Answer:
The data is measured in seconds.
E. How many runners are represented in the table?
Answer:
There are 5 runners represented in the table.
F. How many observations, or measurements, were made?
Answer:
There are 5 observations or measurements made.
Check Understanding
Question 1.
Is the following question a statistical question? Explain. “Did it rain more in Miami or Orlando last month?”
Answer:
Given that,
Did it rain in Miami or Orlando last month?
It is not a statistical question. Because it is answered with a single data point and it has no variability.
Question 2.
The table shows the masses of students’ pets.
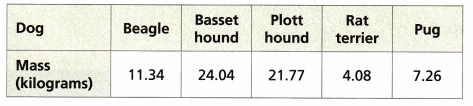
A. How many observations were made?
Answer:
There are 5 observations are made. they are the beagle, basset hound, Plott hound, rat terrier, and pug.
B. What attribute is being measured?
Answer:
The mass attribute is measured.
C. What is the unit of measurement for the data?
Answer:
The unit of measurement for the data is kilograms.
On Your Own
Question 3.
Construct Arguments Carrie asks the following questions:
“How many players per team in the soccer league scored more than 3 goals during the soccer season?”
“How many players per team in the soccer league scored more than 3 goals during the soccer season?”
Which is a statistical question and which is not? Explain your reasoning.
Answer:
Question 4.
Reason Mr. Garcia has students design an experiment that will result in variable data. Which of the following situations could result in a variety of data? Explain.
- measuring the temperature every day for a week
- measuring the average temperature of one week
- measuring the number of high tides for a day
Answer:
Question 5.
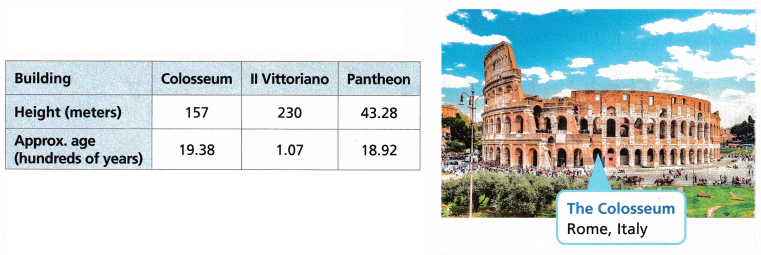
The table shows information about buildings in Rome, Italy. Complete each statement about the data.
There are ![]() attributes.
attributes.
The data were measured using _____________. There are ![]() observations.
observations.
Answer:
The attribute is a characteristic that is used to measure each observation it can vary from one observation to another observation.
There are 3 attributes. The 3 attributes are buildings, Height, and Approximate age.
observation is the realized value of a variable.
The data were measured using meters. There are 3 observations. The three observations are colosseum, II vittoriano, and pantheon.
I’m in a Learning Mindset!
How do I explain the difference between statistical questions and non-statistical questions?
Answer:
A statistical question means it is a question that can be answered by collecting the data in which the variability is given.
The non-statistical question has only one answer because it has no variability in the data.
Lesson 14.1 More Practice/Homework
Question 1.
Which of the following is not a statistical question? Explain.
- What are the ages of your neighbor’s pets?
- How many days are there in March?
- What is the time it takes each runner to finish a race at a track meet?
Answer:
The statistical question is a question that can be answered by using the collecting data that can vary.
How many days are there in march is not a statistical question.
Question 2.
Light bulbs are labeled with the number of watts of electricity they use as shown by the table. What are the attributes, measurements used, and observations of the data?
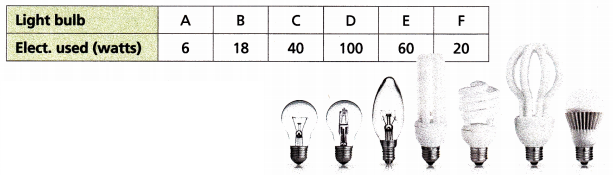
Attributes: ______________
Measurements Used: ______________
Observations: ______________
Answer:
The attribute is a characteristic that is used to measure each observation it can vary from one observation to another observation.
The attributes are light and electricity used.
The measurement used is the watts.
observation is the realized value of a variable.
Observations are the data of the A, B, C, D, E, and F.
Question 3.
Open-Ended Write two statistical questions that you could use to gather data about your family.
Answer:
The first statistical question is
How many teeth are there in each person in your family?
The second statistical question is
How many hours that each person can swim in your family?
Question 4.
Reason Kate asks her friend what her favorite class at school is. How could she change her questioning so that she can collect statistical data?
Answer:
The question that Kate asks her friend what her favorite class at school is changed into Kate asks her friend what her marks in her favorite class in each test at school.
Question 5.
Hector collected the data shown in the table for a basketball league. What are the attributes, measurements used, and observations of the data?
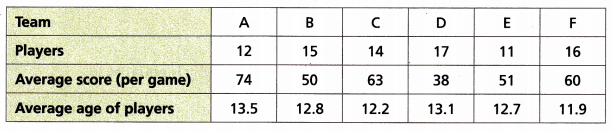
Attributes: ______________
Measurements Used: ______________
Observations: ______________
Answer:
The total number of Attributes is 4 they are team, players, average score, and the average age of players.
The attribute is a characteristic that is used to measure each observation it can vary from one observation to another observation.
The measurement used is age.
The observations are the data of the A, B, C, D, E, and F.
observation is the realized value of a variable.
Test Prep
Question 6.
Which of the following are statistical questions? Select all that apply.
(A) How many total tomato plants are in a large garden pot?
(B) How many cucumber plants are in each backyard garden in a neighborhood?
(C) What was the low temperature in my town in December in 2000?
(D) What percent of sixth grade students at a school don’t like apple juice?
(E) How many flights were delayed at the airport each day last year?
Answer:
How many cucumber plants are in each backyard garden in a neighborhood.
How many flights were delayed at the airport each day last year?
Option B and Option E are the statistical questions. Because it is answered with a single data point and it has no variability.
Question 7.
The data shown in the table were collected during an evaporation experiment. Which statement best describes the data collected?
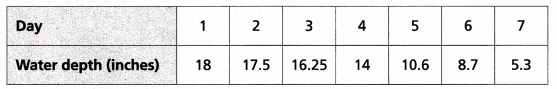
(A) There are 7 observations and 1 attribute. The attribute was likely measured using a measuring cup.
(B) There are 7 observations and 1 attribute. The attribute was likely measured using a ruler.
(C) There is 1 observation and 7 attributes. The attributes were likely measured using a measuring cup.
(D) There is 1 observation and 7 attributes. The attributes were likely measured using a ruler.
Answer:
There are 7 observations and 1 attribute. The attribute was likely measured using a measuring cup.
Cup is a standard measuring instrument.
The attribute is measuring the depth.
The observations are the number of days with data.
Option A is the correct answer.
Spiral Review
Question 8.
A right triangle has an area of 54 square inches and a base of 12 inches. What is the height of the triangle?
Answer:
The formula for the height of the triangle is h = 2 x A/B.
A = 54 sq. inches.
B = 12 sq. inches.
h = 2 x 54/12
h = 9 inches.
Question 9.
What is the volume of a cube with an edge length of 7 centimeters?
Answer:
The formula for the volume of the cube = a³.
a = 7.
V = 7³.
V = 343 cm³.
Question 10.
Write an equation that can be described by the statement: y is equal to \(\frac{1}{3}\) of x.
Answer:
Given that the statement is y = \(\frac{1}{3}\) of x.
\(\frac{1}{3}\) of x = 1/3 of x.
y = 1/3x.