We included HMH Into Math Grade 6 Answer Key PDF Module 14 Data Collection and Displays to make students experts in learning maths.
HMH Into Math Grade 6 Module 14 Answer Key Data Collection and Displays
Data Collection and Analysis

Sales Director
A sales director manages a company’s salespeople. The director helps develop strategies to increase sales of the company’s products. For example, a sales director may help determine the best price to charge for a product by considering the company’s cost to manufacture the product, the amount of profit the company hopes to earn, and the prices charged by other ) companies for similar products.
STEM Task
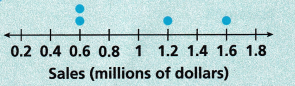
The dot plot shows the total amounts of sales made so far this year by the four salespeople at a small wind turbine company. The company’s sales goal for the year is $8 million How much more is needed to reach the goal? Explain.

Learning Mindset Resilience Monitors Knowledge and Skills

How do you know that you are learning? Whenever you approach a new topic or skill, it is important to pay attention to your understanding. Checking in with yourself before, during, and after learning keeps you focused and helps you identify and address difficulties before they become serious problems. Here are some questions you can ask yourself to monitor your learning.
- What have I learned from this effort?
- Can I explain or demonstrate to someone else what I have learned?
- What am I trying to learn? What is the goal or objective?
- Why am I learning this? What will I know or be able to do after I learn this?
- How is the new topic connected to something I already know? What is the new information?
- What am I learning that I can use next time?
RefIect
Question 1.
How did you first make sense of the STEM Task? Did your understanding change as you worked on the Task? If so, explain.
Answer:
Question 2.
What did you learn from the STEM Task that you can use in your future learning?
Answer:
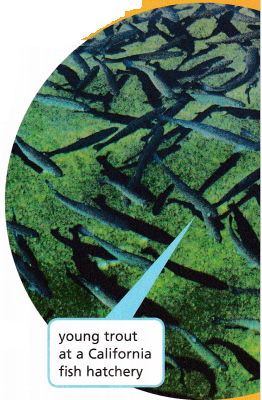
GOING FISHING
Fry, or baby fish, are measured at the hatchery. The weights of 12 fry are shown, in pounds:
1\(\frac{1}{4}\), 1, 1\(\frac{3}{4}\), 2, 1\(\frac{1}{4}\), 1\(\frac{1}{2}\), 1\(\frac{1}{4}\), 1\(\frac{1}{2}\), \(\frac{3}{4}\), 2\(\frac{1}{4}\), 1
Make a line plot to show the data.
A. Organize the data from least to greatest.
Answer:
Given data,
1\(\frac{1}{4}\), 1, 1\(\frac{3}{4}\), 2, 1\(\frac{1}{4}\), 1\(\frac{1}{2}\), 1\(\frac{1}{4}\), 1\(\frac{1}{2}\), \(\frac{3}{4}\), 2\(\frac{1}{4}\), 1
\(\frac{3}{4}\), 1, 1, 1\(\frac{1}{4}\), 1\(\frac{1}{4}\), 1\(\frac{1}{4}\), 1\(\frac{1}{2}\), 1\(\frac{1}{2}\), 1\(\frac{3}{4}\), 2, 2\(\frac{1}{4}\)
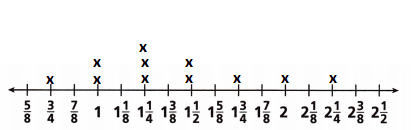
B. Use the data to make a line plot.
Answer:
Turn and Talk
Question 1.
Explain how you made the line plot.
Answer:
1. To create a line plot, first create a number line that includes all the values in the data set.
2. Next, place an X (or dot) above each data value on the number line.
3. If a value occurs more than once in a data set, place an Xs over that number for each time it occurs.
Question 2.
Compare reading the data from a list to reading the data on the line plot. Describe a strength and weakness for each type of display.
Answer:
Are You Ready?
Complete these problems to review prior concepts and skills you will need for this module.
Make and Interpret Line Plots
Question 1.
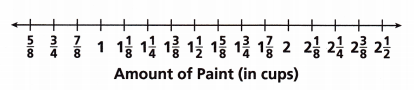
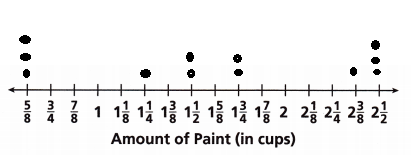
William has a collection of paint jars. He measures the amount of paint in each jar, in cups. Use the data to complete the line plot.
1\(\frac{1}{4}\), 1\(\frac{3}{4}\), 2\(\frac{1}{2}\), \(\frac{5}{8}\), 1\(\frac{1}{2}\), 2\(\frac{3}{8}\), 2\(\frac{1}{2}\), 1\(\frac{3}{4}\), 2\(\frac{1}{2}\), \(\frac{5}{8}\), 1\(\frac{1}{2}\), \(\frac{5}{8}\)
Answer:
Given data,
1\(\frac{1}{4}\), 1\(\frac{3}{4}\), 2\(\frac{1}{2}\), \(\frac{5}{8}\), 1\(\frac{1}{2}\), 2\(\frac{3}{8}\), 2\(\frac{1}{2}\), 1\(\frac{3}{4}\), 2\(\frac{1}{2}\), \(\frac{5}{8}\), 1\(\frac{1}{2}\), \(\frac{5}{8}\)
Question 2.
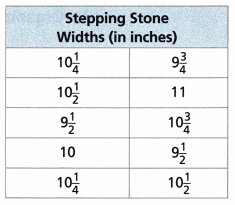
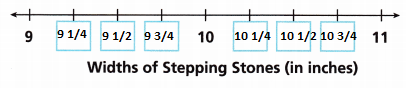
The table shows the widths of different stepping stones, in inches, used to build a path. Complete the line plot to represent the data from the table.
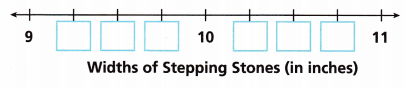
Answer:
Plot Points on a Number Line
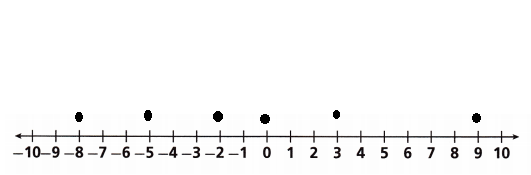
Question 3.
Plot and label each integer.
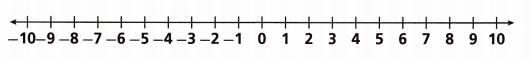
A. -8
B. 3
C. -5
D. 0
E. 9
F. -2
Answer: