We included HMH Into Math Grade 6 Answer Key PDF Module 10 Lesson 3 Write Equations from Tables and Graphs to make students experts in learning maths.
HMH Into Math Grade 6 Module 10 Lesson 3 Answer Key Write Equations from Tables and Graphs
I Can identify patterns in tables and graphs and use the patterns to write equations to represent real-world situations.
Step It Out
Question 1.
Use the table to complete each statement.
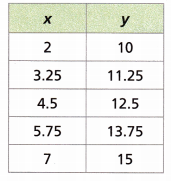
A. Look at the table for patterns. Describe the patterns found in the table.
As x increases by ___________, y increases by ____________.
Each value of y is ___________ units ____________ than the corresponding value of x.
Answer:
As x increases by 1.25, y increases by 1.25.
Each value of y is 8 units greater than the corresponding value of x.
B. Write a verbal model describing an equation in the form y = x + p to represent the relationship between the values in the table.
Answer:
The equation that represents the table is y = x + 8
The equation in the verbal model is some numbers increased by 8.
C. Write an equation using the verbal model.
Answer:
Some number increased by 8 in the verbal model
Consider some number = x
Then the equation is y = x + 8
Turn and Talk What would be the value of x in the table if the corresponding value of y were 25.2? Explain.
Answer:
Given that,
The value pf x is 25.2
Then the value of y is 25.2 + 8 = 33.2
Question 2.
Mara is making bracelets. For every red bead, she uses 4 green beads. The graph represents this situation. Use the graph to complete each part.
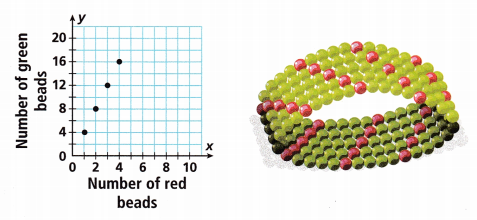
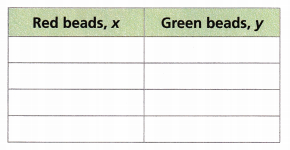
A. Read the ordered pairs from the graph. Use them to complete the table.
Answer:
The given coordinates (x, y) in the graph are (1, 4), (2, 8), (3, 12), (4, 16).
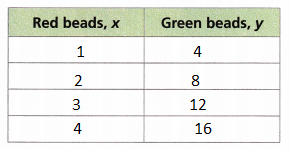
B. Look at the table for patterns. Describe the patterns found in the table.
As x increases by ___________, y increases by ___________.
Each value of y is ______________ the corresponding value of x.
Answer:
From the table the equation is y = 4x.
As x increases by 1, y increases by 4.
Each value of y is 4 the corresponding value of x.
C. Write a verbal model of the form y = px to represent the relationship between the values in the table
Answer:
From the table the equation is y = 4x.
The verbal model of the equation is some number is multiplied by the 4.
D. Write an equation using the verbal model.
Answer:
Some number is multiplied by 4 is the verbal model
Consider some number = x
The equation using the verbal model is y = 4x.
Turn and Talk In Task 2, should the dots be connected in the graph? Explain why or why not.
Answer:
You can model real-world situations using an equation.
Question 3.
The graph shows the distance d, in miles, a car traveled over time t, in hours.
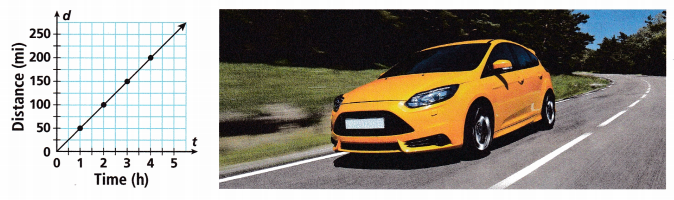
A. Write the coordinates of the points on the graph as ordered pairs.
![]()
Answer: (1, 50) (2, 100) (3, 150) and (4, 200)
B. Complete the sentence to describe the pattern shown in the graph.
As the first coordinate of each of the points increases by ___________, the second coordinate of each of the points increases by ____________.
Answer: As the first coordinate of each of the points increase by 1, the second coordinate of each of the points increases by 50.
C. The value of the distance d, in miles, is always _____________ the value of the time t, in hours. So the equation that models the relationship is ___________.
Answer: The value of the distance d, in miles, is always 50 times the value of the time t, in hours. So, the equation that models the relationship is y = 50x
Turn and Talk Why does it make sense to have the line connecting the points on the graph in Task 3 but not in Task 2. Explain.
Answer: The line connecting the points on the graph is based on the x and y coordinates.
Check Understanding
Write an equation representing each table or graph.
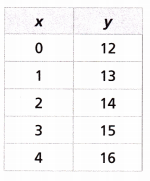
Question 1.
Answer:
The equation that represents the table is y = x + 12.
If x = 0 then y = 0 + 12 = 12
x = 1 then y = 1 + 12 = 13
x = 2 then y = 2 + 12 = 14
x = 3 then y = 3 + 12 = 15
x = 4 then y = 4 + 12 = 16
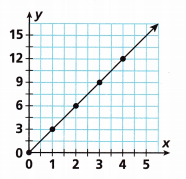
Question 2.
Answer:
From the graph the coordinates points are (1,3), (2,6), (3,9), (4,12).
The equation is y = 3x.
If x = 1 then y = 3(1) = 3
x = 2 then y = 3(2) = 6
x = 3 then y = 3(3) = 9
x = 4 then y = 3(4) = 12.
On Your Own
Question 3.
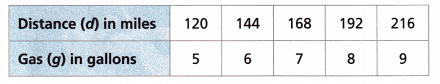
Construct Arguments The table represents the distance driven using various amounts of gas. Write an equation that models the distance d, in miles, with respect to gas g, in gallons. Explain your answer by describing patterns in the table.
Answer:
The equation that models the distance d, in miles, with respect to gas g, in gallons is d = 24g
If g = 5 then d = 24(5) = 120
g = 6 then d = 24(6) = 144
g = 7 then d = 24(7) = 168
g = 8 then d = 24(8) = 192
g = 9 then d = 24(9) = 216
Question 4.
The graph represents the relationship between the total cost, in dollars, of a city taxi and the number of miles driven.
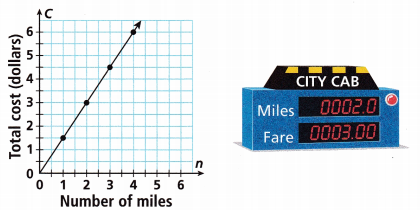
A. Write an equation that relates C, the cost in dollars, to n, the miles driven.
Answer:
The coordinates points are (1, 1.5), (2,3), (3,4.5).
The equation that relates to the C, the cost in dollars to n is y = 1.5x
If x = 1.5 then y = 1.5(1) = 1.5
x = 2 then y= 1.5(2) = 3.
x = 3 then y = 1.5(3) = 4.5
B. Reason Suppose the points in the graph are all increased by three dollars. Write an equation that relates C, the new cost in dollars, to n, the miles driven. If the number of miles driven is 6, what would the cost be? Explain how you found the new equation.
Answer:
The equation that relates to the C, the cost in dollars to n is y = 1.5x
x = 6 then y = 1.5(6) = 9
If the number of miles driven is 6 then the cost is 9.
Question 5.
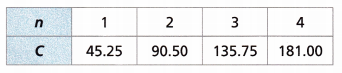
Model with Mathematics The table represents the cost C, in dollars, of a cell phone data plan for n months. Write an equation that represents the data in the table.
Answer:
The equation that represents the cost C, in dollars, of a cell phone data plan for n months is C = 45.25n
If n = 1 then C = 45.25(1) = 45.25
n = 2 then C = 45.25(2) = 90.50
n = 3 then C = 45.25(3) = 135.75
n = 4 then C = 45.25(4) = 181
Question 6.
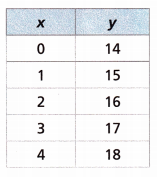
Model with Mathematics Write an equation representing each table or graph.
A.
Answer:
The equation representing the table is y = 14 + x = 0
If x = 0 then y = 14 + 0 = 14
x = 1 then y = 14 + 1 = 15
x = 2 then y = 14 + 2 = 16.
x = 3 then y = 14 + 3 = 17.
x = 4 then y = 14 + 4 = 18.
B.
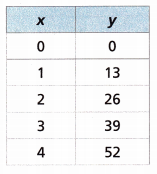
Answer:
The equation that represents the table is y = 12x + x
If x = 0 then y = 12x + x = 12(0) + 0 = 0
x = 1 then y = 12(1) + 1 = 13
x = 2 then y = 12(2) + 2 = 26
x = 3 then y = 12(3) + 3 = 39
x = 4 then y = 12(4) + 4 = 52
C.
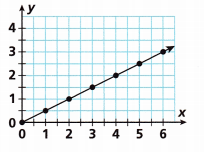
Answer:
The given coordinates are (0,0), (1, 0.5), (2,1), (3,1.5), (4,2), (5,2.5), (6,3).
The equation that represents the table is y = 0.5x
If x = 0 then y = 0.5(0) = 0
If x = 1 then y = 0.5(1) = 0.5
x = 2 then y = 0.5(2) = 1
x = 3 then y = 0.5(3) = 1.5
x = 4 then y = 0.5(4) = 2.
x = 5 then y = 0.5(5) = 2.5
x = 6 then y = 0.5(6) = 3
D.
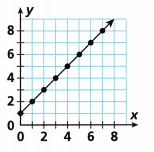
Answer:
The given coordinates are (0,1), (1,2), (2,3), (3,4), (4,5), (5,6), (6,7), (7,8).
The equation that represents the table is y = x + 1
If x = 0 the y = 0 + 1 = 1
x = 1 then y = 1 + 1 = 2
x = 2 then y = 2 + 1 = 3
x = 3 then y = 3 + 1 = 4
x = 4 then y = 4 + 1 = 5
x = 5 then y = 5 + 1 = 6
x = 6 then y = 6 + 1 = 7
x = 7 then y = 7 + 1 = 8.
E.
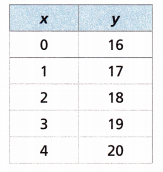
Answer:
The equation that represents the table is y = 16 + x.
If x = 0 then y = 16 + 0 = 16.
x = 1 then y= 16 + 1 = 17.
x = 2 then y = 16 + 2 = 18.
x = 3 then y = 16 + 3 = 19
x = 4 then y = 16 + 4 = 20
F.
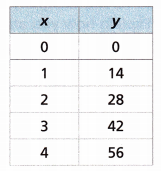
Answer:
The equation that represents the table is y = 14x
If x = 0 then y =14(0) = 0
x = 1 then y = 14(1) = 14
x = 2 then y = 14(2) = 28
x = 3 then y = 14(3) = 42
x = 4 then y = 14(4) = 56.
G. Look for Repeated Reasoning Examine the tables and graphs. What do you notice about the equations for the tables and graphs that include the point (0, 0)? What do you notice about the equations for the tables and graphs that do not include the point (0, 0)?
Answer: We noticed that the equations for the tables and the graphs are included the points (0,0).
Question 7.
The table shows the monthly costs for a smartphone plan with Company A. The advertisement shows the cost of Company B’s plan.
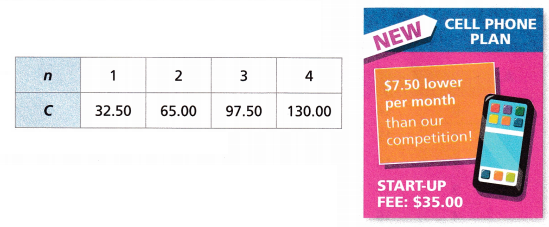
A. Use Structure Write an equation that models the total cost C, in dollars, for n months of Company B’s plan. Explain.
Answer:
B. Complete the table for Company B’s plan.
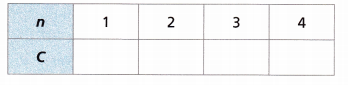
Answer:
C. After how many months will Company B’s plan cost less than Company A’s plan? Explain how you arrived at your answer.
Answer:
Model with Mathematics For Problems 8-9, write an equation representing each table or graph.
Question 8.
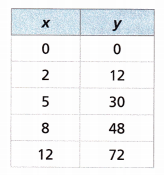
Answer:
The equation that represents the table is y = 6x
If x = 0 then y = 6(0) = 0
x = 2 then y = 6(2) = 12
x = 5 then y = 6(5) = 30.
x = 8 then y = 6(8) = 48
x = 12 then y = 6(12) = 72
Question 9.
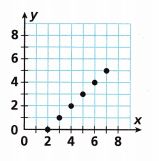
Answer:
The coordinates in the graph are (2,0), (3,1), (4,2), (5,3), (6,4), (7,5).
The equation that represents the graph is y = x – 2
If x = 2 then y = 2 – 2 = 0
x = 3 then y = 3 – 2 = 1
x = 4 then y = 4 – 2 = 2
x = 5 then y = 5 – 2 = 3
x = 6 then y = 6 – 2 = 4
x = 7 then y = 7 – 2 = 5
Lesson 10.3 More Practice/Homework
Question 1.
The graph shows the total sales of tickets to a school performance.
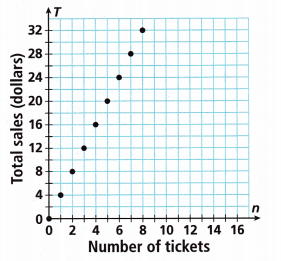
A. Write an equation that relates the total sales to the number of tickets sold. Use T for the total sales and n for the number of tickets.
Answer:
The coordinates are (0,0), (1,4), (2,8), (3,12), (4,16), (5,20), (6,24), (7,28), (8,32).
The equation that relates the total sales to the number of tickets sold is T = 4n
If n = 0 then T = 4(0) = 0
n = 1 then T = 4(1) = 4
n = 2 then T = 4(2) = 8
n = 3 then T = 4(3) = 12
n = 4 then T = 4(4) = 16
n = 5 then T = 4(5) = 20
n = 6 then T = 4(6) = 24
n = 7 then t = 4(7) = 28
n = 8 then T = 4(8) = 32
B. If the number of tickets sold is 125, what will be the total sales?
Answer:
Given that the number of tickets sold is 125.
The equation that relates the total sales to the number of tickets sold is T = 4n
If n = 125 then
T = 4(125) = 500.
Therefore the total sales are 500.
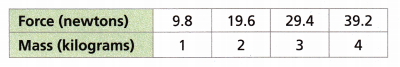
Question 2.
STEM The table shows the relationship between the mass m and the force w of weights on the ground. Write an equation representing this relationship.
Answer:
The equation that representing the relationship between the mass m and the force w of weights on the ground is f = 9.8m
If m = 1 then f = 9.8(1) = 9.8
m = 2 then f = 9.8(2) = 19.6
m = 3 then f = 9.8(3) = 29.4
m = 4 then f = 9.8(4) = 39.2
Model with Mathematics For Problems 3-6, write an equation representing each graph or table.
Question 3.
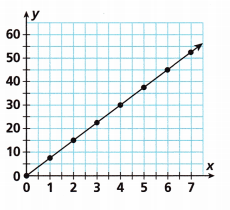
Answer:
The (x, y) coordinates in the graph are (0,0), (1,7.5), (2,15), (3,22.5), (4,30), (5,37.5), (6,45).
The equation that represents the table is y = 7.5x
If x= 0 then y = 7.5(0) = 0
x = 1 then y = 7.5(1) = 7.5
x = 2 then y = 7.5(2) = 15
x = 3 then y = 7.5(3) = 22.5
x = 4 then y = 7.5(4) = 30
x = 5 then y = 7.5(5) = 37.5
x = 6 then y = 7.5(6) = 45
Question 4.
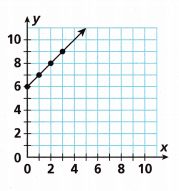
Answer:
The (x, y) coordinates in the graph is (0,6), (1,7), (2,8), (3,9).
The equation that represents the graph is y = 6 + x
If x = 0 then y = 6 + 0 = 6
x = 1 then y = 6 + 1 = 7
x = 2 then y = 6 + 2 = 8
x = 3 then y = 6 + 3 = 9
Question 5.
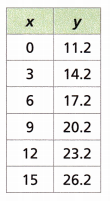
Answer:
The equation that represents the table is y = x + 11.2
If x = 0 then y = 11.2
x = 3 then y = 3 + 11.2 = 14.2
x = 6 then y = 6 + 11.2 = 17.2
x = 9 then y = 9 + 11.2 = 20.2
x = 12 then y = 12 + 11.2 = 23.2
x = 15 then y = 15 + 11.2 = 26.2
Question 6.
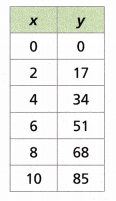
Answer:
The equation that represents the table is y = 8.5x
If x = 0 then y = 8.5(0) = 0
x = 2 then y = 8.5(2) = 17
x= 4 then y = 8.5(4) = 34
x = 6 then y = 8.5(6) = 51.
x = 8 then y = 8.5(8) = 68.
x = 10 then y = 8.5(10) = 85
Test Prep
Question 7.
The partially completed table contains some values for x and y.
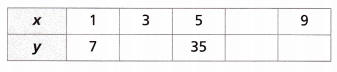
A. Use patterns to complete the table.
Answer:
The equation relationship between the x and y is y = 7x
If x = 1 then y = 7(1) = 7
x = 3 then y = 7(3) = 21
x = 5 then y = 7(5) = 35
x = 7 then y = 7(7) = 49
x = 9 then y = 7(9) = 63
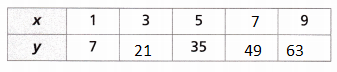
B. Write an equation that models the relationship between x and y.
Answer:
The equation relationship between the x and y is y = 7x
If x = 1 then y = 7(1) = 7
x = 3 then y = 7(3) = 21
x = 5 then y = 7(5) = 35
x = 7 then y = 7(7) = 49
x = 9 then y = 7(9) = 63
Question 8.
Brenda sells balloon bouquets. She charges the same price for each balloon in a bouquet. The costs for several bouquets are shown in the table. Write an equation that relates the cost of a bouquet to the number of balloons in the bouquet.
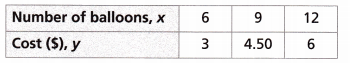
Answer:
The equation that relates the cost of a bouquet to the number of balloons in the bouquet is
y = x/2
If x = 6 then y = 6/2 = 3
x = 9 then y = 9/2 = 4.50
x = 12 then y = 12/2 = 6
Question 9.
Which equation represents the relationship between x and y shown in the graph?
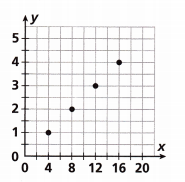
(A) y = 0.25x
(B) y = 0.5x
(C) y = 2x
(D) y = 4x
Answer:
The equation y = 0.25x represents the relationship between x and y.
The (x, y) coordinates in the graph are (4,1), (8,2), (12,3), (16,4)
If x = 4 then y = 0.25(4) = 1
x = 8 then y = 0.25(8) = 2
x = 12 then y = 0.25(12) = 3
x = 16 then y = 0.25(16) = 4
Option A is the correct answer.
Spiral Review
Question 10.
Evaluate the expression for a = 3 and b = \(\frac{1}{4}\).
5a – 16b + 7
Answer:
5a – 16b + 7
a = 3 and b = \(\frac{1}{4}\)
5(3) – 16(\(\frac{1}{4}\)) + 7
15 – 4 + 7
11 + 7 = 18
Question 11.
What is the opposite of -3.5?
Answer:
-3.5 is the negative number the opposite of the negative number is the positive number.
So, the opposite of -3.5 is 3.5
Question 12.
Combine like terms: 4(x2 – 3) + 2x2 + 8
Answer:
4(x2 – 3) + 2x2 + 8
4x2 – 12 + 2x2 + 8
6x2 -4
4(x2 – 3) + 2x2 + 8 = 6x2 – 4