We included HMH Into Math Grade 3 Answer Key PDF Module 18 Lesson 6 Make Line Plots to Display Measurement Data to make students experts in learning maths.
HMH Into Math Grade 3 Module 18 Lesson 6 Answer Key Make Line Plots to Display Measurement Data
I Can measure lengths to the nearest quarter inch and make a line plot to display the data.
Spark Your Learning
Some students compare the lengths of their used pencils. Measure the length of each pencil to the nearest quarter inch.
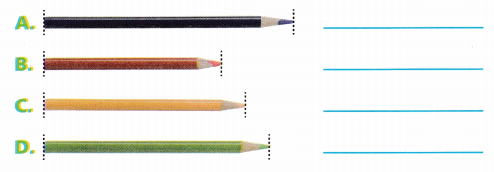
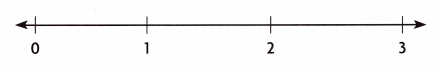
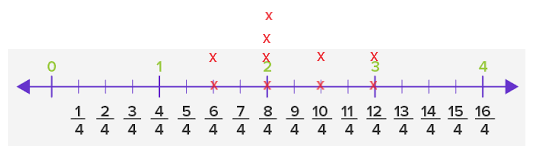
Use the number line to record the lengths of the pencils.
Answer:
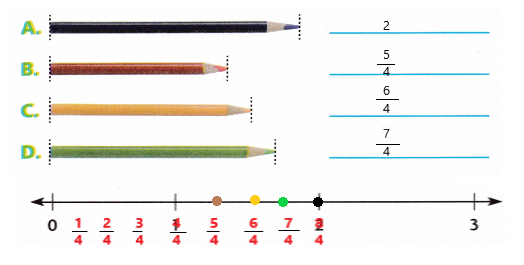
Explanation:
I measured the lengths and marked them on a number line.
Turn and Talk Do you think if you measure more pencils you might find some pencils with the same lengths measured to the nearest quarter inch? How would the number line change?
Answer:
There would be more number of plots on the number line between 1 to 2.
Build Understanding
Question 1.
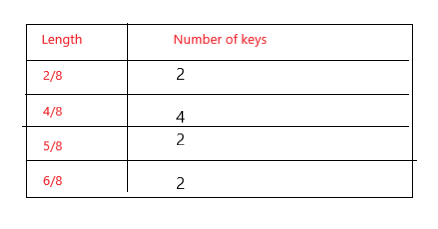
You can sort keys by length.
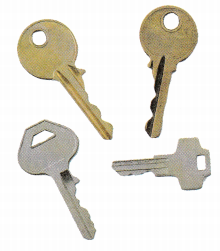
Use a ruler marked with quarter inches. Measure the length of 10 keys to the nearest quarter inch.
Record the data you collect. Then organize your data in a table or tally chart.
Answer:
Turn and Talk Share your work. Discuss the different ways you used to organize the data.
Answer:
I organized the data in the form of a table.
Step It Out
Question 2.
Use the measurement data that you collected. Make a line plot to show how many times you measured each key length.
A. Write a title below the line.
Answer:
The title is lengths of the keys.
B. Write numbers or fractions in order, as labels below the number line.
Answer:
I wrote the fractions in order as labels below the number line.
C. Draw an X above the line at each length For a length that matches the data.
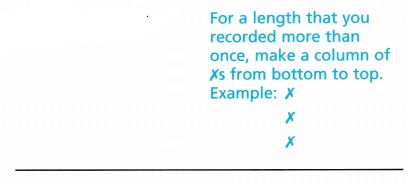
Answer:
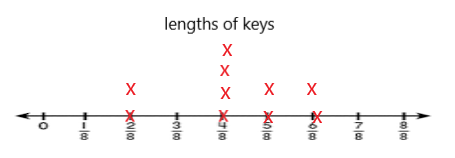
D. Describe your line plot.
Answer:
My line plot shows the number of keys and their lengths.
Check Understanding
Use your line plot above.
Question 1.
Write a problem about how many more keys have one length than another length. Solve your problem.
Answer:
Using the above data how many more keys have length more than half inch?
Answer:
4
Explanation:
After half inch in the above line plot their are 4 marks. So, there are 4 keys that are more than half inch in length.
On Your Own
Question 2.
Attend to Precision Measure and record the length of 10 used crayons to the nearest quarter inch.
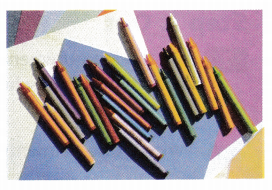
Make a line plot to show the data.

Answer:
Use Structure Use your line plot for 3-4,
Question 3.
Which length of crayon appears most often?
Answer:
2 inch
Question 4.
Describe your line plot in as many ways as you can.
Answer:
My line plot shows the number of crayons and their lengths.
I’m in a Learning Mindset!
What is preventing me from using and making line plots and graphs?
Answer: