We included HMH Into Math Grade 3 Answer Key PDF Module 18 Represent and Interpret Data to make students experts in learning maths.
HMH Into Math Grade 3 Module 18 Answer Key Represent and Interpret Data
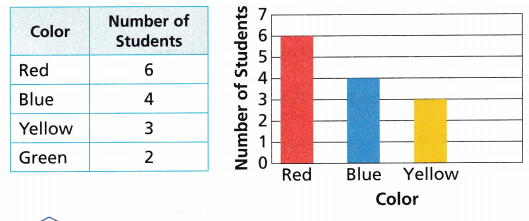
What is missing from the graph?
- Sam and Max ask students in their class to choose their favorite color. The choices are red, blue, yellow, and green. They share the results in a table.
- Next, Max and Sam start to make a bar graph. Help them complete the graph.
Turn and Talk
The bar graph is also missing a title. What would be a good title for this graph?
Answer:
The bar graph title is choosing a favourite colour.
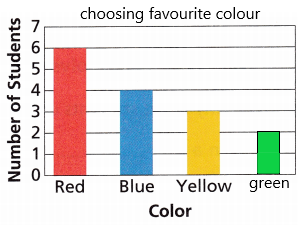
The missing colour has also been drawn to complete the bar graph. The above data helps to solve the given problem.
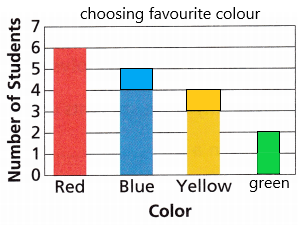
If you and a partner choose your favourite colour, how would that change the graph?
Answer:
If I choose my favourite colour is yellow and my partner’s favourite colour is blue then the bar graph will change because another 2 members were added. Then the bar graph will be
Are You Ready?
Complete these problems to review prior concepts and skills you will need for this module.
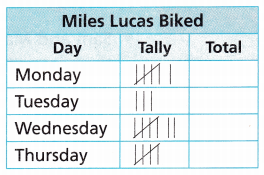
Read a Tally Chart
Complete the tally chart. Then use the tally chart to answer the questions.
Question 1.
How many more miles did Lucas bike on Thursday than on Tuesday?
Answer:
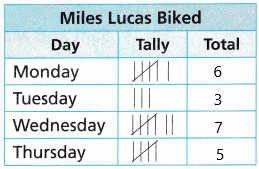
The number of miles Lucas biked on thursday=5
The number of miles Lucas biked on Tuesday=3
The number of more miles did Lucas biked on Thursday and tuesday=X
X=5-3
X=2
Therefore, 2 more miles Lucas biked on Thursday and tuesday.
Question 2.
How many miles did Lucas bike in all?
Answer:
the number of Lucas biked on monday=6
the number of Lucas biked on Tuesday=3
the number of Lucas biked on Wednesday=7
the number of Lucas biked on Thursday=5
The number of miles in total=X
Now add all the weekdays to get the answer.
X=6+3+7+5
X=21
Therefore, 21 miles Lucas biked in all.
Picture Graphs
Use the picture graph to solve the problems.
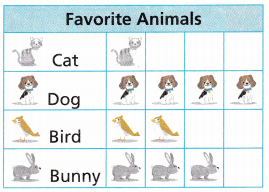
Question 3.
How many more students choose a dog than a cat?
Answer:
the number of students who choose a dog=4
the number of students who choose a cat=1
the number of more students who choose a dog than cat=X
X=4-1
X=3
Therefore, 3 more students choose a dog than a cat.
Question 4.
Which animal do the most students choose?
Answer:
the number of students who choose a dog=4
the number of students who choose a cat=1
the number of students who choose a bird=2
the number of students who choose a bunny=3
Now compare all the animals and which animal is having the highest number that will be the answer.
A dog is having the highest rate.
So, most of the students choose dogs.
Bar Graphs
Use the bar graph to solve the problems.
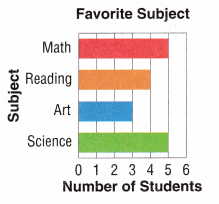
Question 5.
Which subject did the fewest students choose?
Answer:
The number of students who choose science is 5
The number of students who choose art=3
the number of students who choose reading=4
The number of students who choose maths=5
now compare all the subjects which are having the lowest mark that will be the answer
Arts is having the lowest mark.
Thus, Arts is the subject the fewest students choose.
Question 6.
How many fewer students chose art than reading?
Answer:
The number of students who choose art=3
the number of students who choose reading=4
The number of fewer students chose art than reading=X
x=4-3
x=1
Therefore, 1 fewer student choose art than reading.