We included HMH Into Math Grade 1 Answer Key PDF Module 8 Lesson 4 Represent Data with Tally Charts to make students experts in learning maths.
HMH Into Math Grade 1 Module 8 Lesson 4 Answer Key Represent Data with Tally Charts
I Can make a tally chart to organize information and use it to answer questions.
Spark Your Learning
Draw to show two more items in the group. How can you tally the data?
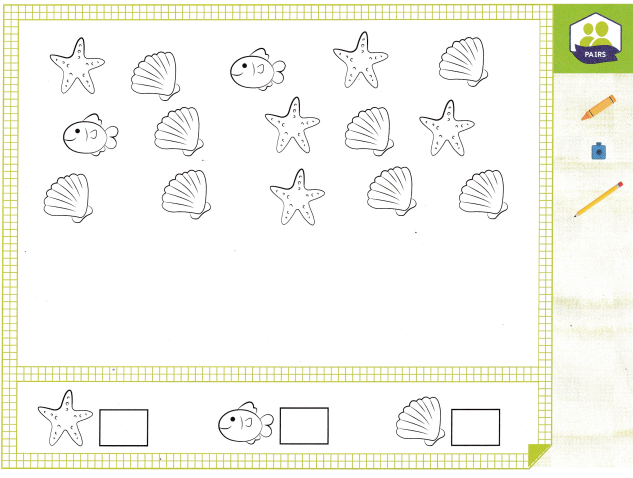
Children work in pairs. Have each child draw one more object of his or her choice (starfish, fish, or seashell) to the picture, adding a total of two objects to the data. Then have children work together to tally what they see.
Answer:
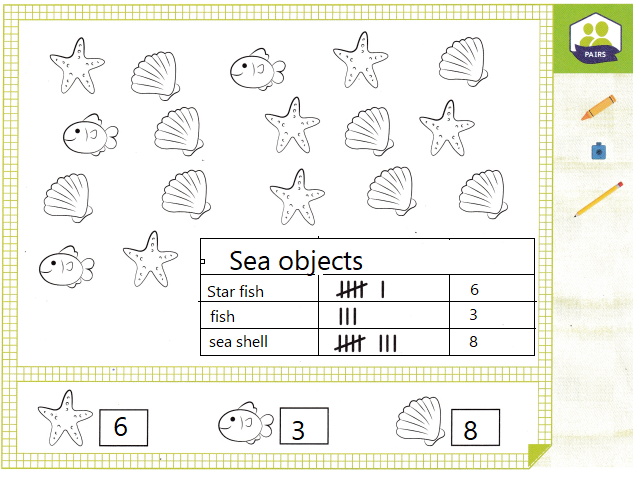
Explanation:
Total number of star fishes that children saw are 6
Total number of fishes that children saw are 3
Total number of sea shell that children saw are 8
Drawn one more fish to the table and a fish also added.
Build Understanding
Martha sees these insects in a yard.
A. How can you make a tally chart to show the insects?
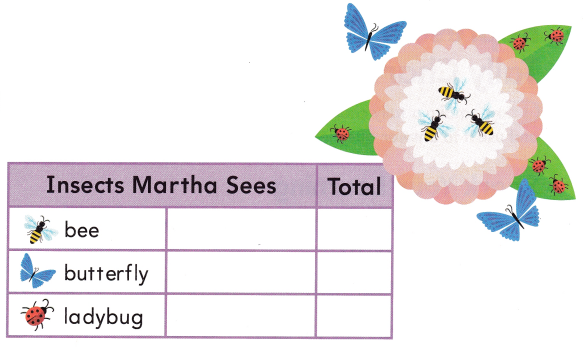
How can you use the tally chart to answer questions?
Explanation:
A tally chart is a simple way of recording and counting frequencies.
Each occurrence is shown by a tally mark and every fifth tally is drawn diagonally to make a “gate” of five.
The tallies can then be counted to give the frequency.
B. How many ![]() does Martha see?
does Martha see?
___ ![]()
Explanation:
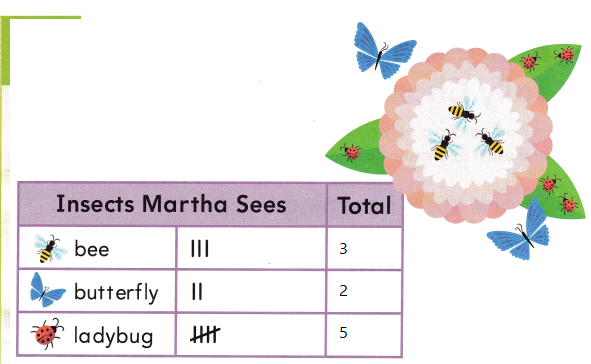
According to the data in the tally chart
Total number of bees that Martha see is 3
C. How many insects does Martha see?
___ insects
Explanation:
There are 3 types of insect
Martha mentioned in the tally chart.
They are Bees
Butterflies
and the lady bugs.
D. How many more ![]() than
than ![]() does Martha see? ___ more
does Martha see? ___ more
Explanation:
Number of bugs are 5
Number of Butterflies are 2
let n be the more number of insect
n = 5 – 2
n = 3
There are 3 more bugs than butterflies.
E. How many fewer ![]() than
than ![]() does Martha see? ___ fewer
does Martha see? ___ fewer
Explanation:
Number of bugs are 5
Number of bees are 3
let n be the fewer number of insect
n = 5 – 3
n = 2
There are 2 fewer bees than bugs.
Turn and Talk How do tally marks help you keep track of the information?
Explanation:
Each occurrence is shown by a tally mark and every fifth tally is drawn diagonally to make a “gate” of five. The tallies can then be counted to give the frequency.
Step It Out
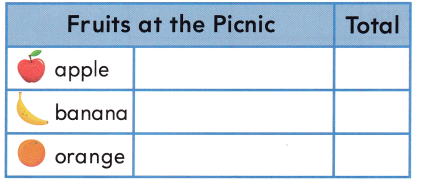
1. Use the picture to make a tally chart. Then use the chart to answer the question
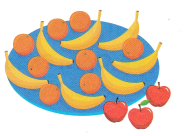
A. Make a tally mark for each apple, banana, and orange shown in the picture. Then write the total number of each kind of fruit.
Explanation:
B. How many pieces of fruit are there?
THINK: Make ten to help you add.
___ + ___ + ___ = ___
___ pieces of fruit
Explanation:
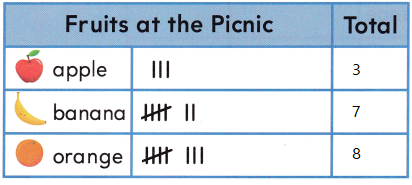
3 + 7 + 8 = 18
18 pieces of fruit
Number of apples in the picture = 3
Number of bananas in the picture = 7
Number of oranges in the picture = 8
Total number of fruits are = 3 + 7 + 8 = 18
Check Understanding Math Board
Use your tally chart to answer the questions.
Question 1.
Are there more ![]() or
or ![]() ? Circle your answer.
? Circle your answer.

Answer:
Explanation:
Number of bananas in the picture = 7
Number of oranges in the picture = 8
Let n be the unknown more
n = Number of bananas – Number of oranges
n = 8 – 7
n = 1
Question 2.
How many fewer ![]() are there than
are there than ![]() ?
?
___ fewer
Answer:
5 fewer apples.
Explanation:
Number of apples in the picture = 3
Number of oranges in the picture = 8
n = Number of apples- Number of oranges
n = 8 – 3
n = 5
On Your Own
Question 3.
Open Ended Ask 10 children which color they like best. Record their answers in a tally chart.
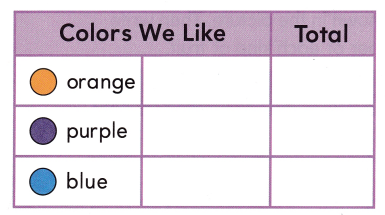
Answer:
Explanation:
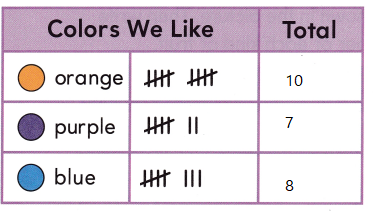
Number of children choose orange = 10
Number of children choose purple = 7
Number of children choose blue = 8
Question 4.
Which color did most children choose? Circle your answer.
![]()
Answer:
Explanation:
Number of children choose orange = 10
Number of children choose purple = 7
Number of children choose blue = 8
10 is greater than 7 and 8
so, number of children choose oranges are more.
Question 5.
Reason If all the children you asked chose the same color, what would the tally marks look like for that color in the chart?
Answer:
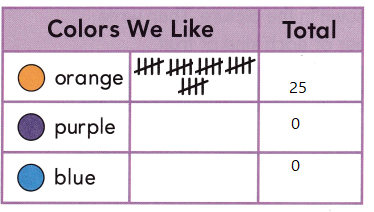
Explanation:
If all the children you asked chose the same color
Number of children choose orange = 25
Number of children choose purple = 0
Number of children choose blue = 0
I’m in a Learning Mindset!
How do I help my class understand tally charts?
- Place a group of 3 objects in front of the child.
- Tell the child, “I can show this number by making a mark for each object.”
- Let the child watch you as you draw a mark for each object, counting as you make the tally marks, “One, Two, Three.”