Go Math Grade 3 Answer Key Chapter 2 Represent and Interpret Data Assessment Test covers all the topics of Chapter 2. Through this assessment test, you can test your preparation level and get a good grip on the concepts easily. 3rd Grade Go Math Chapter 2 Represent and Interpret Data Assessment Test you can cover the entire syllabus easily.
Enhance your math skills, by referring to the Go Math Grade 3 Answer Key Chapter 2 Represent and Interpret Data Assessment Test and score better grades in your exam. We even Provided Step by Step Solutions for all the Grade 3 Go Math Answer Key Ch 2 making it easy for you to get grip on the subject.
Chapter 2: Represent and Interpret Data Assessment Test
- Test – Page 1 – Page No. 21
- Test – Page 2 – Page No. 22
- Test – Page 3 – Page No. 23
- Test – Page 4 – Page No. 24
- Test – Page 5 – Page No. 25
- Test – Page 6 – Page No. 26
Test – Page 1 – Page No. 21
Question 1.
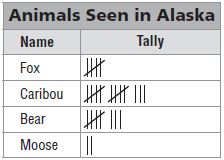
John made a tally table to record the animals he saw on a trip to Alaska.
For numbers 1a–1c, select True or False for each statement.
a. John saw twice as many bears as foxes.
i. True
ii. False
Answer: False
Explanation: John saw foxes 4 times wherein bears 7 times, which is not double to 4.
Question 1.
b. John saw 5 more caribou than bears.
i. True
ii. False
Answer: False
Explanation: He saw 4 more caribou than bears.
Question 1.
c. John saw 4 fewer moose than foxes.
i. True
ii. False
Answer: False
Explanation: He saw 2 fewer moose than foxes, not 4.
Question 2.
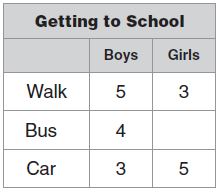
Kayla asked 26 students in her class how they traveled to school. The frequency table shows the results.
Part A
Complete the table and explain how you found the answer.
______ girls
Answer: 6 girls.
Explanation:
Total no of students in class = 26
Let’s consider no of girls travel by bus = X
Total no of girls traveled to school = 3+X+5 = 8+X
Total no of boys traveled to school = 12
Therefore no of girls travel by bus X=(Total no of students in the class– (No of girls travel by walk and car + boys traveled by all three))
= 26 – (8+12)
= 6.
Question 2.
Part B
How many more students are there who travel by car or bus to school than students who walk to school? Show your work.
______ more students
Answer: 10 more students.
Explanation:
No of students travel by car or bus = 4 + 6 + 3 + 5 = 18
No of students travel by walk = 5 + 3 = 8
Difference between both = 10
Therefore 10 more students travel by car or bus to school than students who walk to school.
Test – Page 2 – Page No. 22
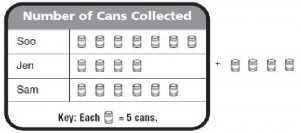
Use the picture graph for 3– 6.
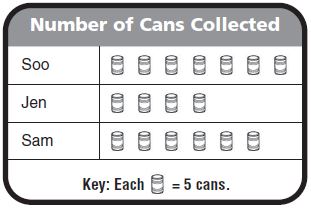
Three friends are collecting canned food for the food bank. The picture graph shows the number of cans collected so far.
Question 3.
How many cans were collected? Explain how you found the total.
______ cans
Answer: 85 cans.
Explanation: Soo collected 7 symbols, Jen collected 4 symbols and Sam collected 6 symbols
Total symbols collected by all three = 7+4+6 = 17
Given that each symbol = 5 cans, Total no of cans collected = 17 × 5 = 85 cans.
Question 4.
Choose the name from each box that makes the sentence true.
Ten fewer cans were collected by  than
than  .
.
Answer: Jen collected Ten fewer cans than Sam
Explanation:
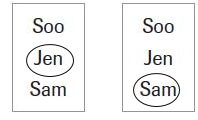
Jen collected 4×5 = 20 cans, Sam collected 6×5 = 30 cans and
Soo collected 7×5 = 35cans
Difference between Jen and Sam = 30 -20 = 10
Difference between Jen and Soo = 35 – 20 = 15
Therefore the given statement can be written as Jen collected Ten fewer cans than Sam.
Question 5.
How many more cans did Soo collect than Jen?
______ cans
Answer: 15 more cans.
Explanation:
Jen collected 4×5 = 20 cans, Soo collected 7×5 = 35cans
Difference between Jen and Soo = 35 – 20 = 15cans.
Question 6.
Jen collects 20 more cans. Draw a picture to show how the graph will change.
Answer: In the below picture added 4 more symbols to Jen, which means added 20 more cans.
Explanation:
Test – Page 3 – Page No. 23
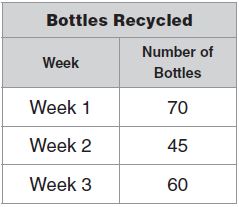
Use the frequency table for 7–8.
Question 7.
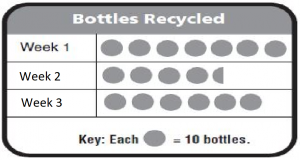
Ms. Green’s class is recycling bottles to help the environment. The frequency table shows the number of bottles the class recycled each week.
Part A
Use the data in the table to complete the picture graph.
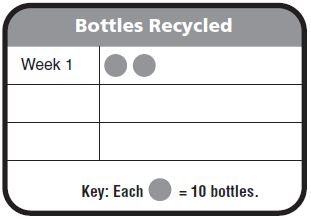
Answer: Since we circle symbol represents 10 bottles. We drew 7 for week 1, 4 half for week 2, and 6 for week 3.
Explanation:
Question 7.
Part B
How many pictures did you draw for Week 2? Explain.
Answer: 4 ½
Explanation: Because each circle represents 10 bottles, we drew 4 circles to represent 40 bottles and 1 half circle to represent 5 bottles.
Question 8.
The class has a goal of recycling 250 bottles during the month. How many more bottles do they need to recycle in Week 4 to meet that goal?
Options:
a. 100 bottles
b. 175 bottles
c. 75 bottles
d. 55 bottles
Answer: 75 bottles.
Explanation: Given 70 bottles are recycled in week 1, 45 in week 2, 60 in week 3, so in week 4 the number of bottles recycled is
250-175= 75 bottles.
Test – Page 4 – Page No. 24
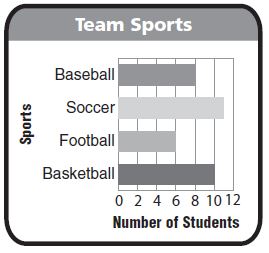
Use the bar graph for 9–12.
Question 9.
Two more students play basketball than which other sport?
_________
Answer: Two more students play basketball than baseball.
Explanation: From the graph, we understood that 8 students play baseball and 10 students play Basketball. Therefore 2 more students play basketball than baseball.
Question 10.
How many students play either baseball or soccer?
______ students
Answer: 19 students.
Explanation: 8 students play baseball wherein 11 students play soccer. Therefore a total of 19 students play either baseball or soccer.
Question 11.
For numbers 11a–11d, select True or False for each statement.
a. Ten more students play basketball than play football.
i. True
ii. False
Answer: False.
Explanation: Only two more students play basketball than play football.
Question 11.
b. Eleven students play soccer.
i. True
ii. False
Answer: True.
Explanation: We can see in the graph as 11 students played soccer.
Question 11.
c. 34 students play a sport.
i. True
ii. False
Answer: False
Explanation: We can see in the graph as a total of 35 students plays a sport.
Question 11.
d. Five fewer students play football than play soccer.
i. True
ii. False
Answer: True.
Explanation: No of students play football = 8, No of students play soccer = 11.
The difference between both is 3, so about 5 fewer students play football than soccer.
Question 12.
There are more students who play volleyball than play football, but fewer students play volleyball than play basketball. Explain how you could change the bar graph to show the number of students who play volleyball.
Answer: Since it was given that more students play volleyball than football, the bar for volleyball will be somewhere between 6 and 10. We could add the data at the top of the graph, above the bar for baseball.
Test – Page 5 – Page No. 25
Use the frequency table for 13–14.
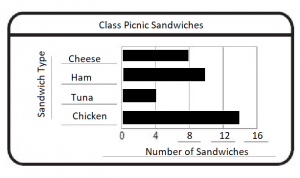
Question 13.
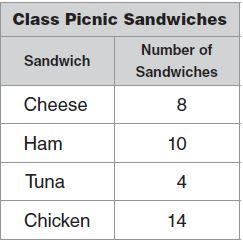
For the class picnic people have a choice of four kinds of sandwiches. The frequency tableshows the number of sandwiches chosen.
Part A
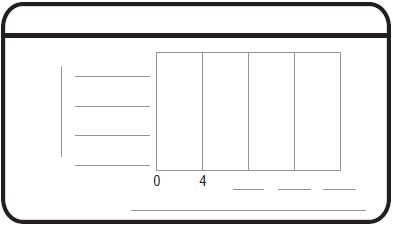
Use the data in the table to complete the bar graph.
Answer:
Question 13.
Part B
How do you know how long to make the bars on your graph? How did you show 14 chicken sandwiches? Explain.
Answer: I drew the bars to end at the number of choices shown in the table. Since 14 is halfway between 12 and 16 the bar stops in the middle of the space between 12 and 16.
Question 14.
How many more are there of the two sandwiches that were chosen the most than of the two sandwiches that were chosen the least? Explain how you solved the problem.
______ sandwiches
Answer: 12 Sandwiches.
Explanation: People chose 10 + 14 = 24 of the two most popular sandwiches. People chose 8 + 4 12 of the least popular sandwiches. The difference is 24 − 12 = 12 sandwiches.
Test – Page 6 – Page No. 26
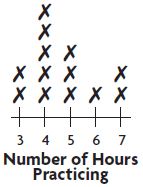
Use the line plot for 15–16.
Yuji made a line plot to show the number of hours each student in his music class practiced every week.
Question 15.
For numbers 15a–15d, select True or False for each statement.
a. Three students practiced exactly 5 hours each week.
i. True
ii. False
Answer: True
Explanation: We can see on the graph as 3 students practiced exactly 5 hours each week.
Question 15.
b. Seven students practiced 4 hours or less each week.
i. True
ii. False
Answer: True.
Explanation: We can see on the graph as Seven students practiced 4 hours or less each week.
Question 15.
c. Six students practiced exactly 1 hour each week.
i. True
ii. False
Answer: False
Explanation: In the graph, one hour is not represented.
Question 15.
d. Two students practiced more than 6 hours each week.
i. True
ii. False
Answer: True
Explanation: We can see on the graph as two students practiced more than 6 hours each week.
Question 16.
What if two more students joined the class and each practiced 9 hours a week? Describe what the line plot would look like.
Answer: If two more students join, each practicing 9 hrs a week. Then the line plot would be extended to 9. There would be two Xs above the 9. The 8 in the line plot would have no Xs marked.
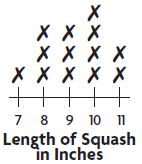
Use the line plot for 17–18.
Paige grew squash in her garden. She measured the length of each squash to the nearest inch and recorded the data in the line plot.
Question 17.
How many squash were 10 inches or longer?
_____ squash
Answer: 6 squashes.
Explanation: 6 squashes were 10 inches and more than 10 inches longer
Question 18.
How many more squash were 9 inches long than 7 inches long?
_____ squash
Answer: 2 squashes
Explanation: 2 more squash was 9 inches longer than 7 inches long.
Conclusion
Test your knowledge using the Go Math Grade 3 Answer Key Chapter 2 Represent and Interpret Data Assessment Test and identify the knowledge gap. To get more help lookup to Go Math Grade 3 Answer Key Chapter 2 Represent and Interpret Data and clear your queries.