Everyday Mathematics 6th Grade Answer Key Unit 1 Data Displays and Number Systems
Everyday Math Grade 6 Home Link 1.2 Answer Key
Exploring Dot Plots and Landmarks
Question 1.
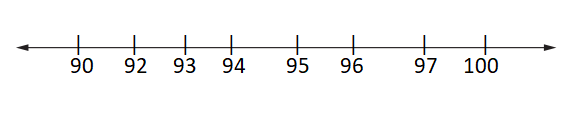
Draw a dot plot for the following spelling test scores:
100, 100, 95, 90, 92, 93, 96, 90, 94, 90, 97
Answer:
Question 2.
The mode of the data in Problem 1 is ___.
Answer:
Mode = Most repeated observation
Given sequence = 100, 100, 95, 90, 92, 93, 96, 90, 94, 90, 97
So, Mode = 90 {Repeated 3 times}
Therefore, Mode of the data = 90
Question 3.
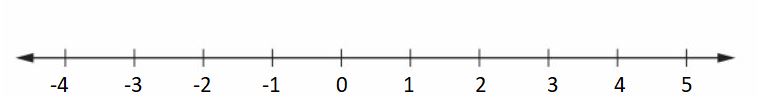
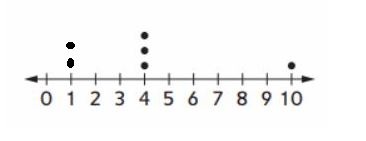
Draw a dot plot that represents data with the landmarks shown below. Use at least 10 numbers.
Answer:
Question 4.
Explain how you decided where to place your data on the dot plot in Problem 3.
Answer:
The difference between numbers 1.
From 0, to right side, add 1 number
From 0, to left side, subtract 1 number
Question 5.
Describe a situation the data in the dot plot in Problem 3 might represent.
Answer:
Integers i.e., positive numbers, negative numbers including zero.
Question 6.
Give the dot plot a title. Be sure to label the unit (for example, dollars or miles) for the number line.
Answer :
Integers i.e., positive numbers, negative numbers including zero.
Find an interesting graph on the Internet or in a newspaper or magazine. Bring it to class tomorrow.
Answer:
Everyday Mathematics Grade 6 Home Link 1.3 Answers
Using the Mean to Solve Problems
Question 1.
Ms. Li brought pumpkin seed packs for her class. Each student received a pack. Her class predicted that there were 30 seeds in each pack. Here are the total number of seeds per pack the students in one group found when they counted: 20, 21, 23, 20, 22, 20.
Find the group mean for the pumpkin seed packs. ____ pumpkin seeds
Answer: 21
Explanation :
Given,
Number of seeds student counted : 20,20,20,21,22,23
Total no. of observations =6
Mean = sum of observations / total number of observations
Group mean = 20+20+20+21+22+23 /6
= 126/6
= 21
Therefore, group mean for given data is 21
Question 2.
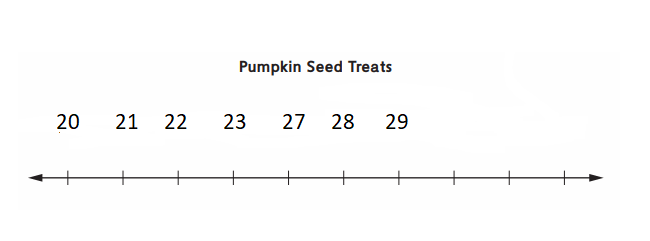
Another group in Ms. Li’s class added their pumpkin seed counts to the data set. Here is what they have all together: 20, 21, 23, 20, 22, 20, 23, 27, 28, 29, 28, 27.
Make a dot plot for the combined data.
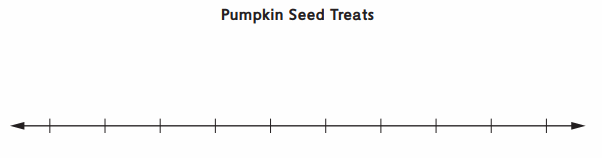
Answer:
Find these landmarks for this data set.
Median: ___ Mode(s): __ Mean: ___
Answer:
Median= If the total observations are even, then average of middle two numbers is median
20,20,20,21,22,23,23,27,27,28,28,29
middle numbers are 23,23
average = 23+23 /2 =23
Therefore, Median = 23.
Mode= Most repeated observation in total observation.
20 is the most repeated observation (3 times)
Therefore, Mode = 20.
Mean= sum of observations / Total number of observations.
= 20+20+20+21+22+23+23+27+27+28+28+29 /12
= 288/12
= 24
Therefore, Mean = 24
Question 3.
If Ms. Li brought these packs every day for 20 days of class, about how many seeds would each student receive?
Answer:
Total number of students : 6+12 = 18
If each pack have 24 seeds, then for 20 days = 24*20 = 480
Number of seeds that each student receive =480/18 = 26.67 (approximately 27)
Therefore, number of seeds each student receive is 27
Try This
Question 4.
If you were in charge of advertising these pumpkin seed packs, how many seeds would you advertise are in each pack ? Why?
Answer: If I was the in charge of advertising these pumpkin seed packs, i will advertise 24 seeds in each pack. Because, it is the mean of majority group (12 members) total number of observations of seeds in pack.
Practice
Question 5.
4 ∗ 12 = __________________________
Answer: 48
Question 6.
___ 6 = 6 ∗ 12
Answer:
Question 7.
15 ∗ 5 = ___
Answer: 75
Question 8.
___ = 13 ∗ 4
Answer: 52
Everyday Math Grade 6 Home Link 1.4 Answer Key
Balancing Movies
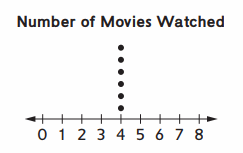
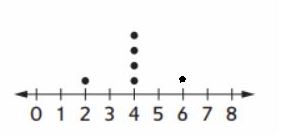
Sandy asked six students how many movies they watched last month, and then graphed the results. The mean number of movies watched was 4.
Question 1.
How likely is it that Sandy’s graph would look like the graph at the right? Explain.
_______________________
________________________
Answer:
Given,
Mean is 4
Therefore, Mean = Sum of Observations / Total number of observations
Mean = 4+4+4+4+4+4 /6
= 24/6
= 4 Which is given Mean
Hence, it is exact graph to represent the data.
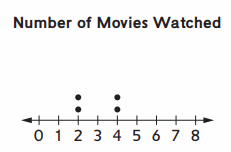
Question 2.
Suppose that five students answered as shown. How many movies did the sixth student watch? ___
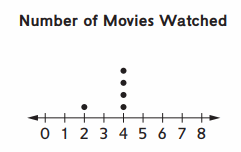
Plot the sixth point on the dot plot and explain how you know where to place it.
Answer:
Sixth student watched Six Movies.
Explanation :
Given,
Mean is 4
Mean = sum of observations / total number of observations
let, the movies watched by sixth member is x
then, 2+4+4+4+4+4+x /6 =4
18+x /6 =4
x= 24-18 =6
Therefore, total number of movies watched is six (6)
Each dot represents the person and the number represents rthe number of movies watched. Hence, there should be one dot at number six on number line.
Question 3.
Suppose that four students answered as shown. How many movies could the last two students watch?
_______________
Answer :
Given,
Mean is 4
Mean = sum of observations / total number of observations
let,the movies watched by two members be x+x = 2x
2+2+4+4+x+x /6 =4
12+2x =24
2x =12
x =6
Therefore, each student watched six movies.
Plot the last two points on the dot plot and explain how you know where to place them.
Answer :
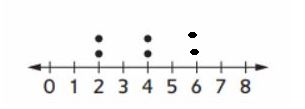
Each dot represents the person and the number represents rthe number of movies watched. Hence, there should be two dots at number six on number line.
Try this
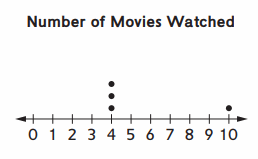
Question 4.
The data shown at the right is for four of six students surveyed. What two missing data points would make the mean 4?
Answer :
Given,
Mean is 4
Mean = sum of observations / total number of observations
let, movies watched by two members be x+x =2x
4+4+4+10+x+x /6 =4
22+2x =24
2x=2
x=1
Therefore, two students watched one movie each.
Plot the points on the dot plot.
Answer :
Practice
Solve.
Question 5.
46 ÷ 2 =
Answer: 23
Question 6.
80 ÷ 5 =
Answer: 16
Question 7.
68 ÷ 2 =
Answer: 34
Everyday Mathematics Grade 6 Home Link 1.5 Answers
Measures of Center
Math test scores (each out of 100 points) are shown below.
Mia’s scores: 75, 75, 75, 85, 80, 95, 85, 90, 80, 80
Nico’s scores: 55, 80, 90, 100, 70, 80, 50, 80, 75, 80
Question 1.
Find the median and mean scores for each student.
Mia: Median Mean
Nico: Median Mean
Answer:
Mia Scores : 75,75,75,80,80,80,85,85,90,95
Median = If the total observations are even, then average of middle two numbers is median.
middle numbers are 80,80
average = 80+80 /2 = 80
Therefore, median= 80
Mean = sum of total observations / total number of observations
= 75+75+75+80+80+80+85+85+90+95 /10
= 820/10 = 82
Therefore, Mean is 82
Nico scores : 50,55,70,75,80,80,80,80,90,100
Median = If the total observations are even, then average of middle two numbers is median
middle numbers are 80,80
Average = 80+80 /2 = 80
Therefore, median = 80
Mean = sum of total observations / total number of observations
= 50+55+70+75+80+80+80+80+90+100 /10 = 76
Therefore, Mean is 76
Question 2.
Which better represents each student’s performance, the mean or median? Explain.
Answer :
Mia:
Median = 80
Mean = 82
Nico:
Median = 80
Mean = 76
Mean represents the better student’s performance because it is the average of all the scores they scored.
Question 3.
In their class, a score in the 80s is a B and a score in the 70s is a C. If their teacher uses the medians of their test scores to calculate grades, Mia and Nico would get the same grade. If the teacher uses the mean, Mia would get a B and Nico would get a C. Explain how Mia’s and Nico’s scores have the same median and different means.
__________________________
___________________________
____________________________
Answer:
Mia:
Median = 80
Mean = 82
Nico:
Median = 80
Mean = 76
So, Mia’s grade is B and Nico’s grade is C ( on basis on mean)
Both Mia and Nico’s grade is B (on basis on Median)
Question 4.
If you were the teacher in Mia and Nico’s class, would you use the median or the mean to calculate students’ grades? Explain.
_________________
____________________
If i were the teacher I would like to use Mean to calculate students’ grades. Because, it gives the average scores for each student
Practice Solve.
Question 5.
25 ∗ 30 = _______________
Answer: 750
Question 6.
________ = 16 ∗ 400
Answer: 1/25 = 0.04
Question 7.
150 ∗ 600 =
Answer: 1/4 = 0.25
Question 8.
____ = 90 ∗ 130
Answer: 11700
Everyday Math Grade 6 Home Link 1.6 Answer Key
Analyzing Persuasive Graphs
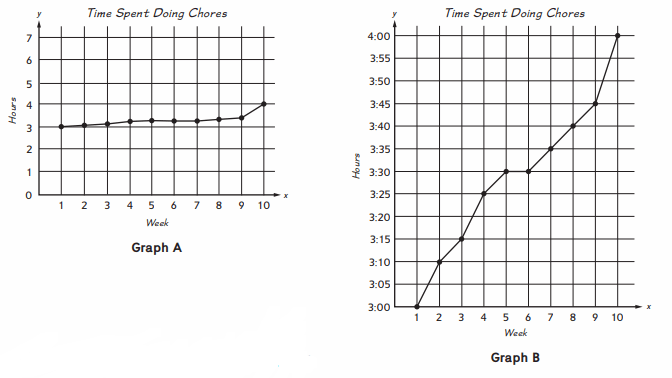
You are trying to convince your parents that you deserve an increase in your weekly allowance. You claim that during the past 10 weeks, the time you have spent doing jobs around the house (such as emptying the trash, mowing the lawn, and cleaning up after dinner) has increased. You have decided to present this information to your parents in the form of a graph. You have made two versions of the graph and need to decide which one to use.
Question 1.
How are Graph A and Graph B similar?
Answer:
Graph A and Graph B are similar because both are showing the work done during 3:00 to 4:00 in the past 10 weeks
Question 2.
How are Graph A and Graph B different?
Answer:
Graph A is showing the Hours on Y-axis from 0 to 7 where Graph b is showing hours on Y-axis only between 3:00 to 4:00
Question 3.
Which graph, A or B, do you think will help you more as you try to convince your parents that you deserve a raise in your allowance? Why?
Answer:
Graph B, because it is showing exact display of the work done in the past 10 weeks.
Analyzing Persuasive Home Link 1-6 Graphs
Question 4.
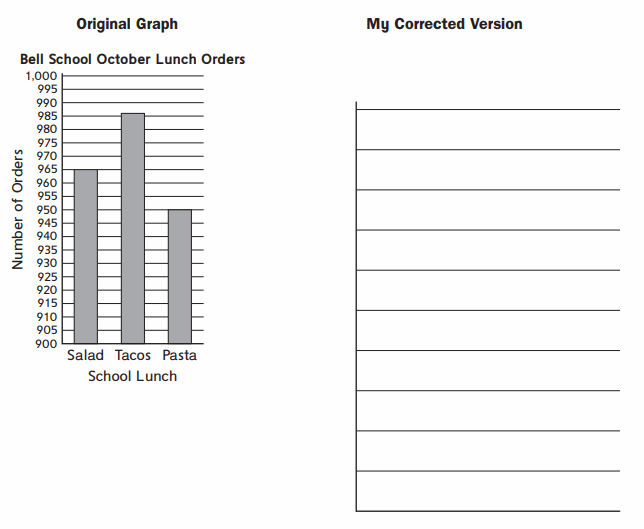
For the graph, describe what you plan to correct. Redraw the graph to give a more accurate picture of the data. Correction(s): ________
Answer:
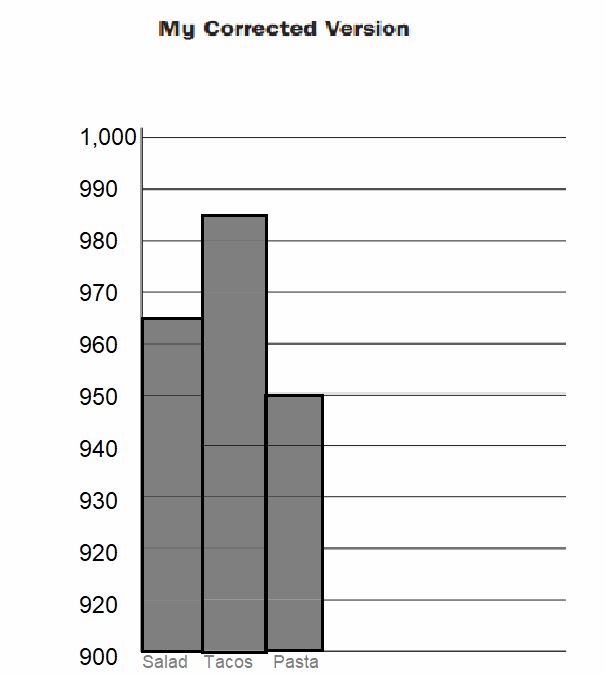
Describe how your corrections changed what you see in the graph.
_______________________________________
_______________________________________
Answer:
A Histogram contains no gaps between the vertical bars
Practice
Solve.
Question 5.
\(\frac{1}{12}\) + \(\frac{7}{12}\) = ___
Answer: 2/3
Explanation:
= 1/12 + 7/12
= 8/12
= 2/3
Question 6.
\(\frac{3}{10}\) + \(\frac{7}{10}\) = ___
Answer: 1
Explanation :
= 3/10 +7/10
= 10/10
= 1
Question 7.
\(\frac{1}{8}\) + \(\frac{3}{8}\) = ___
Answer: 1/2 0r 0.5
Explanation :
= 1/8 + 3/8
= 4/8
= 1/2 0r 0.5
Question 8.
1\(\frac{1}{2}\) + \(\frac{1}{2}\) = ___
Answer: 1
Explanation:
= 1/2 +1/2
= 2/2
= 1
Everyday Mathematics Grade 6 Home Link 1.7 Answers
Exploring Bar Graphs and Histograms
Question 1.
Circle each graph that is a histogram.
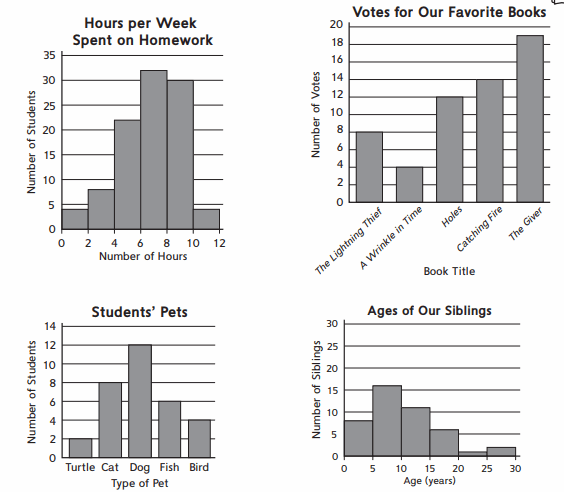
Answer:
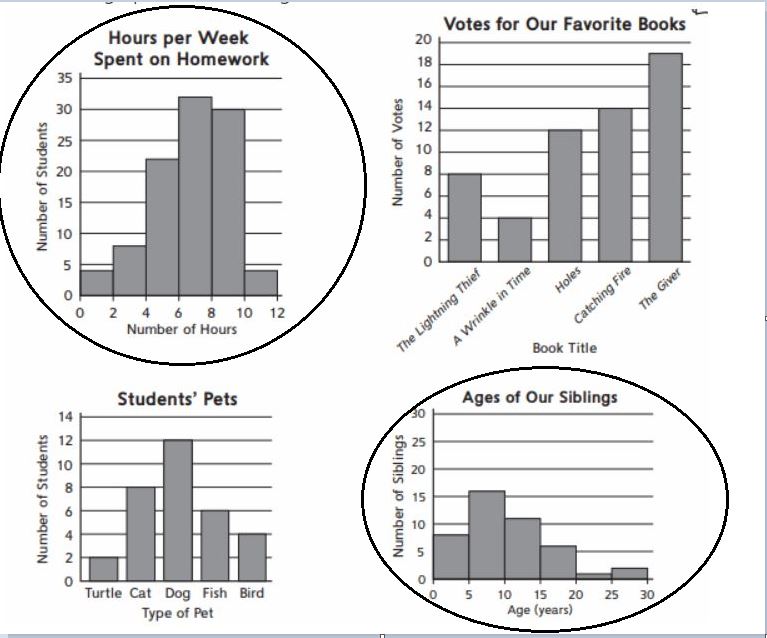
Question 2.
Pick one of the graphs above and list two different questions you could answer with the graph . Do not use the same kind of question twice (even about a different graph).
Answer:
Question No.1
How many students did their homework between 6 to 8 hours (graph 1) ?
Question No.2
What is the age group of highest number of siblings present ?
Question 3.
Describe features of a graph that make it a histogram.
Answer:
A histogram is used to display continuous data in categorical from. There is no gap between the bars in the histogram unlike a bar graph.
Everyday Math Grade 6 Home Link 1.8 Answer Key
Kentucky Derby Winners
Use the graph of Kentucky Derby winners’ times for the problems below.
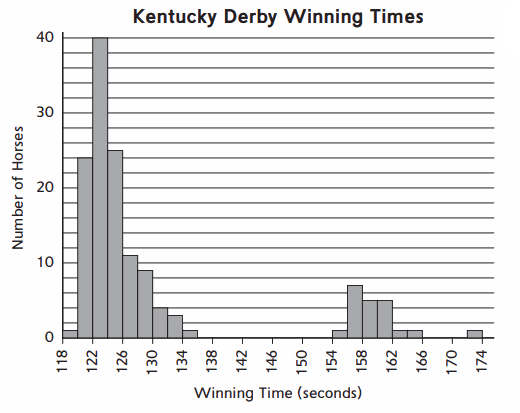
Question 1.
Describe the shape of this graph.
Answer:
Shape of the graph is histogram
Question 2.
Explain why the graph for this data might have this shape.
Answer:
Because,
There is no gap between the bars in the histogram unlike a bar graph.
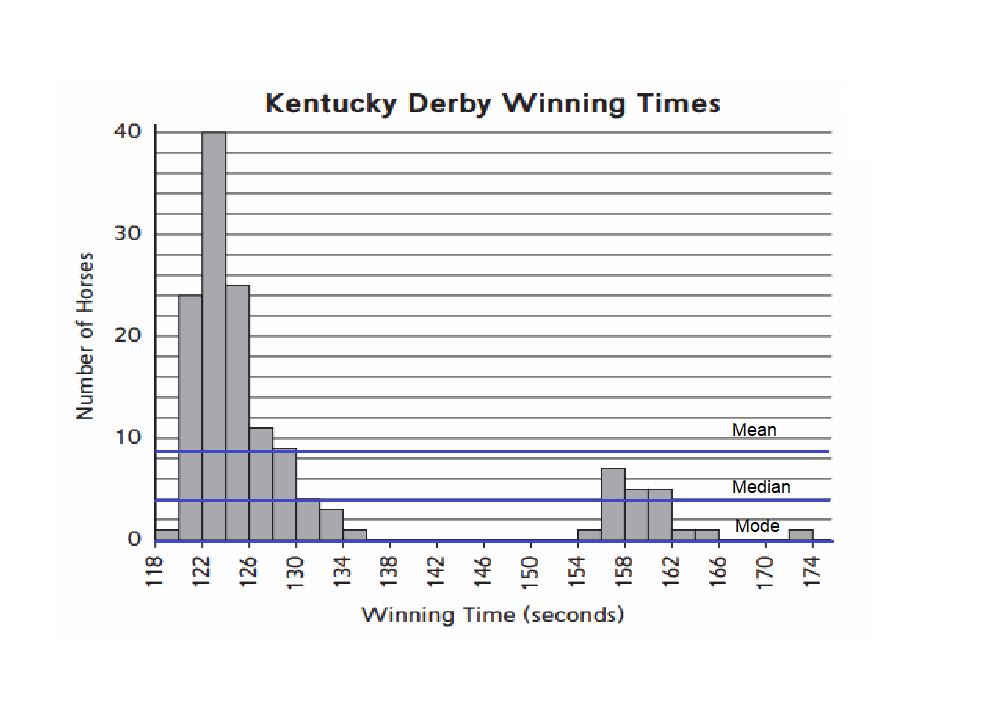
Question 3.
Draw a line on the graph approximately where you think the mean is. Approximately where are the median and the mode compared to the mean?
Answer:
Mean : 8.6
Median : 4
Mode : 0
Try This
Question 4.
Research and describe why the graph of Kentucky Derby winning times is this shape.
________________
Answer:
Because, the data is displayed in histogram as there should be no gaps between the vertical bars.
Practice Solve
Question 5.
___ ∗ 50 = 350
Answer: 7
Explanation :
7*50 =350
Question 6.
60 * 40 = ____
Answer: 2400
Explanation :
60*40=2400
Question 7.
3,600 = 90 * ___
Answer: 40
Explanation :
let the number be x
Then,
x = 3600/90
x=40
Everyday Mathematics Grade 6 Home Link 1.9 Answers
Exploring Histograms
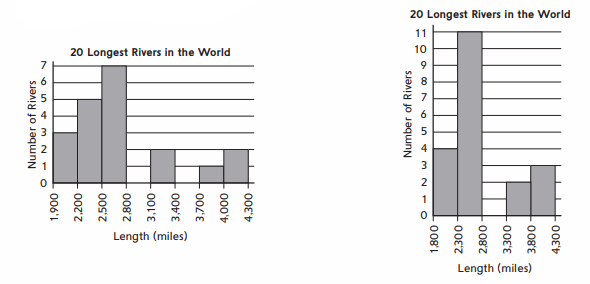
Here are two histograms representing the lengths of the 20 longest rivers in the world.
Question 1.
Describe how the shapes of the graphs are different.
Answer:
The difference between the length of rivers in first histogram in X-axis is 300 miles. where as in second histogram, difference between the length of rivers in X-axis is 500 miles.
First histogram ranges from 1,900 to 4,300 (miles) and there are only maximum of seven rivers in that range. second histogram ranges from 1,800 to 4,300 (miles) and there are only maximum of eleven rivers in that range.
Question 2.
These histograms represent the same set of data. Why do they look different?
Answer:
Because, the difference between the length of rivers in first histogram in X-axis is 300 miles. where as in second histogram, difference between the length of rivers in X-axis is 500 miles. So, even the histograms represent same det of data,they look different.
Question 3.
a. Based on the graphs, what is the largest the range can be?
b. Explain how you figured out the largest possible range.
Answer :
a. Largest range is 500
b. The difference between two successive values gives the Range. in first Histogram Range is 300 Where as in second histogram, Range is 500
Question 4.
a. Estimate the median for the lengths of the 20 longest rivers.
b. Explain how you estimated the median.
Answer:
a. Median is 2.5 for first Histogram. Median is 3.5 for second Histogram.
b. If there are even number of observations, then Median will be the average between two middle numbers.
Everyday Math Grade 6 Home Link 1.10 Answer Key
Plotting Numbers
Question 1.
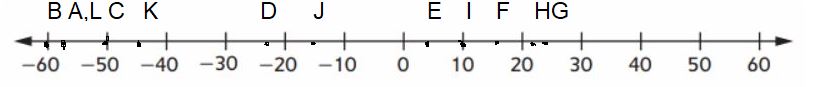
Here is a list by month for the record low temperatures in Minneapolis, MN. Plot the letters for the temperatures on the number line below.
A: January, -57°F
B: February, -60°F
C: March, -50°F
D: April, -22°F
E: May, 4°F
F: June, 15°F
G: July, 24°F
H: August, 21°F
I: September, 10°F
J: October, -16°F
K: November, -45°F
L: December, -57°F
Answer:
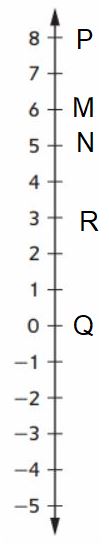
Question 2.
A tree has a trunk, branches, and leaves above ground (positive) and roots below ground (negative). Represent each height as a point on the number line.
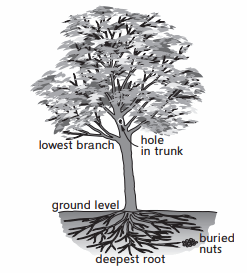
M: Lowest branch at 6 feet
N: Deepest root at 5 feet
P: Hole in trunk at 8 feet
Q: Ground level
R: Buried nuts at 3 feet
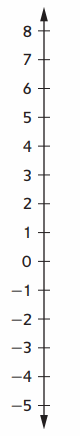
Answer :
Practice
Solve.
Question 3.
$0.40 ∗ 5 =
Answer:
$2
Question 4.
$1.50 ∗ 3 =
Answer:
$4.50
Everyday Mathematics Grade 6 Home Link 1.11 Answers
Fractions on a Number Line
Question 1.
Find three rational numbers between each of the pairs of numbers below.
a. \(\frac{1}{3}\) and \(\frac{5}{6}\)
Answer: 7/6
Explanation :
= 1/3+5/6
= 2(1/3)+5/6
= 2/6+5/6
= 7/6
b. \(\frac{1}{3}\) and \(\frac{1}{5}\)
Answer: 8/15
Explanation :
= 1/3+1/5
= LCM of 3,5 is 15
= 5/15+3/15
= 8/15
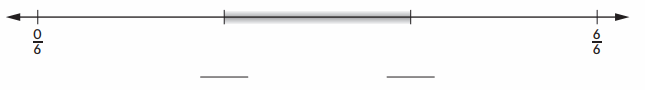
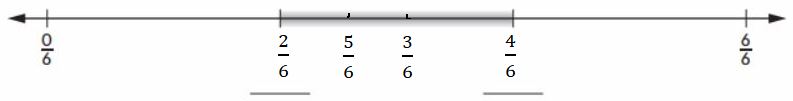
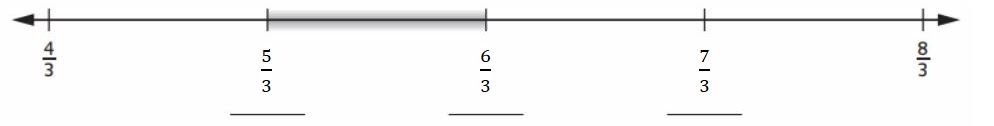
Question 2
a. Label the points on the number line .
Answer :
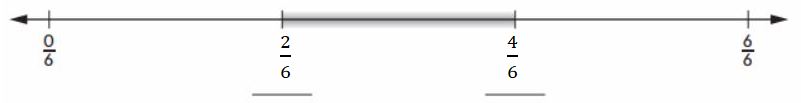
b. Find two fractions in the highlighted section of the number line. ____
Answer :
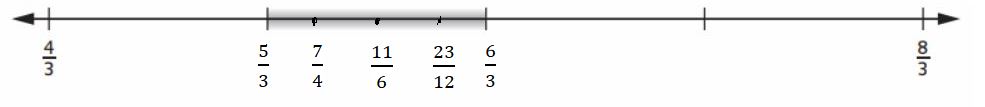
Question 3.
a. Fill in the missing labels on the number line.
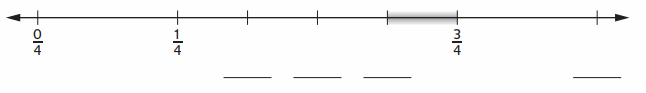
Answer :
b. Find one fraction in the highlighted section of the number line. ___
Answer:
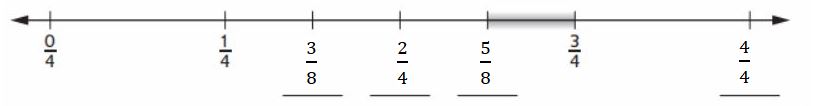
Question 4.
Nadjia created fraction strips to determine that \(\frac{4}{5}\) is smaller than \(\frac{3}{4}\). Here is a sketch of her strips and how she lined them up. What mistake did she make?
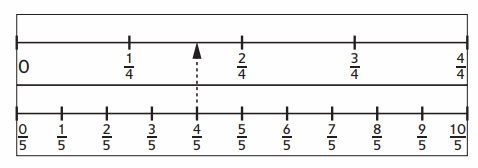
Answer:
The values of 4/5 is 0.8 and is always greater than 0.5. but, she included 4/5 in between 1/4 and 2/4 (from 0.25 to 0.5)
Hence, 4/5 should be placed after 2/4.
Practice
Solve.
Question 5.
\(\frac{3}{4}\) = 
Answer: 12
Explanation :
Let the number be x
= 3/4=x/16
= x=16*3 /4
= x=4*3
therefore, x= 12
Question 6.
\(\frac{18}{20}\) = 
Answer: 9
Explanation :
let the number be x
18/20=x/10
x=18*10 /20
x= 9
therefore value of x is 9
Question 7.
 = \(\frac{3}{4}\)
Answer: 21/4
Explanation :
let the value be x
x/7=3/4
x=7*3 /4
x= 21/4
therefore value of x is 21/4
Everyday Math Grade 6 Home Link 1.12 Answer Key
Zooming In on the Number Line
Question 1.
Maggie says there are no fractions between \(\frac{1}{4}\) and \(\frac{1}{3}\). Provide an example for Maggie and explain why you can always find another example.
Answer:
Question 2.
One way to find fractions in between two fractions is to imagine zooming in on the number line. Insert the missing numbers for the number lines below.
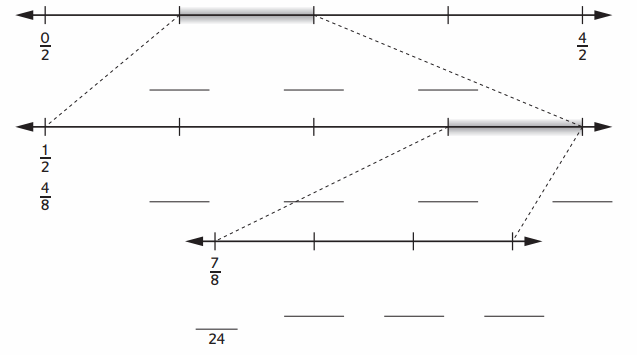
Answer:
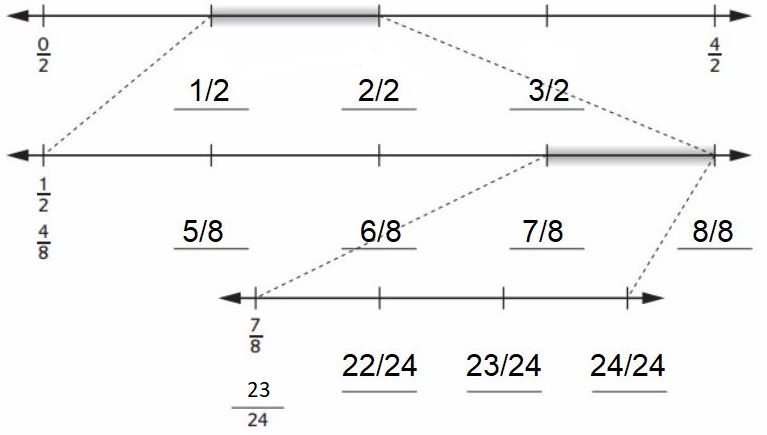
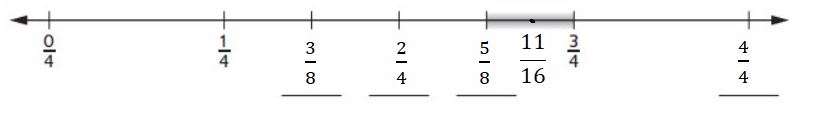
Question 3.
Insert the missing numbers on the number line.
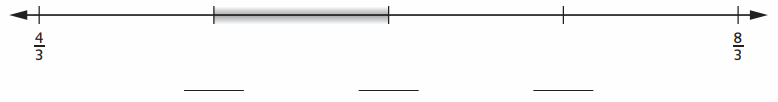
Answer :
List at least three fractions that are in the highlighted section of the number line.
Answer:
Practice
Write an equivalent fraction.
Question 4.
4\(\frac{1}{3}\) =
Answer: 13/3
Question 5.
5\(\frac{2}{9}\) =
Answer: 47/9
Question 6.
2\(\frac{5}{6}\) =
Answer: 17/6
Everyday Math Grade 6 Home Link 1.13 Answer Key
Negative Numbers on a Number Line
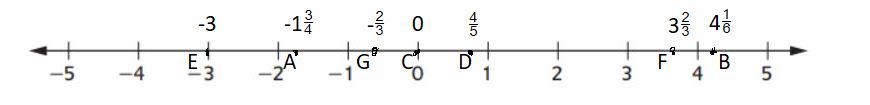
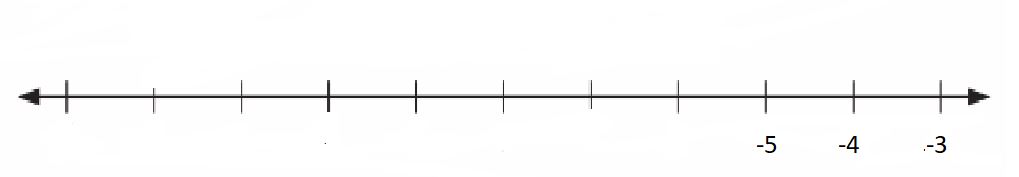
Question 1.
Plot the following points.
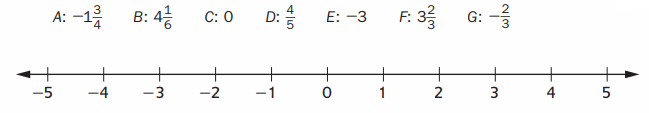
Answer:
Question 2.
a. On the vertical number line, label the topmost and bottommost tick marks as -4 and -5. Label the topmost tick mark with the greater value.
b. Plot and label the following points as accurately as you can. -4\(\frac{1}{2}\), -4\(\frac{1}{3}\), -4\(\frac{2}{3}\), -4\(\frac{1}{4}\), -4\(\frac{2}{4}\), -4\(\frac{3}{4}\), -4\(\frac{1}{6}\), -4\(\frac{2}{6}\), -4\(\frac{3}{6}\), -4\(\frac{4}{6}\), -4\(\frac{5}{6}\)
Answer:
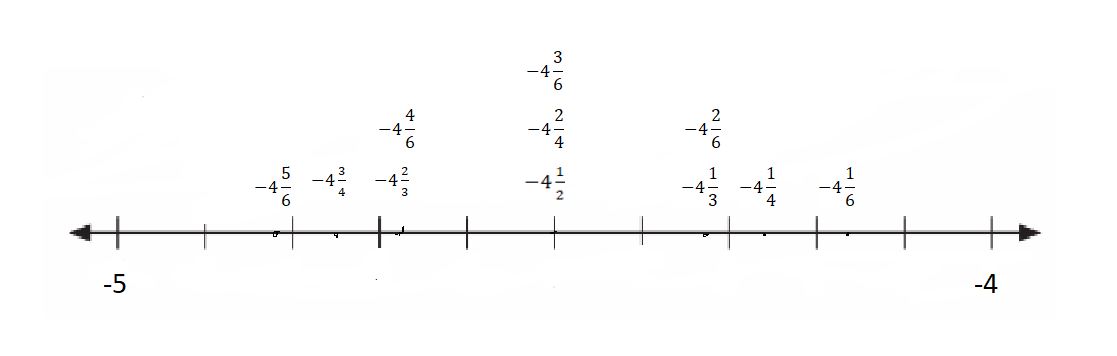
Question 3.
Of the points you plotted on the number line in Problem 2b, which has the greatest value? ___ Which has the least value?__
Answer:
-4 1/6 has the greatest value
-4 5/6 has the least value
Question 4.
How can you use a number line to compare values?
Answer:
As they are negative numbers, the values decreases from left side to right side. Hence, left side values are least when compared to right side.
For Problems 5–6, you may draw a number line to help you.
Question 5.
Write two numbers that fit each description.
a. Between -1 and -2
b. Less than -3
Answer:
a.
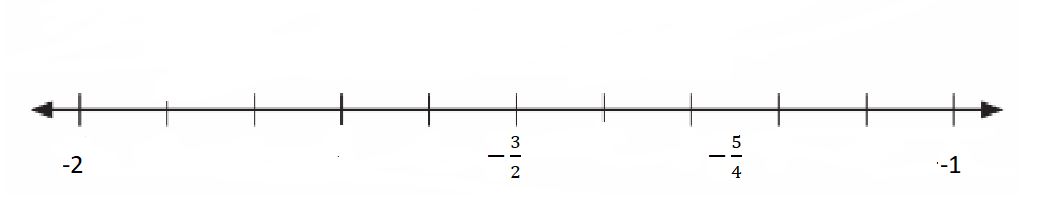
b.
Question 6.
Write the opposite of each number.
a. -4 __
Answer : 4
b. 2\(\frac{1}{2}\) ___
Answer : -2 1/2
c. –\(\frac{3}{4}\) ___
Answer :
3/4
Practice
Write the first three multiples of each number.
Question 7.
9 ___
Answer: 9,18,27
Question 8.
7 ___
Answer: 7,14,21
Question 9.
21 __
Answer: 21,42,63
Everyday Math Grade 6 Home Link 1.14 Answer Key
Plotting Points on a Coordinate Grid
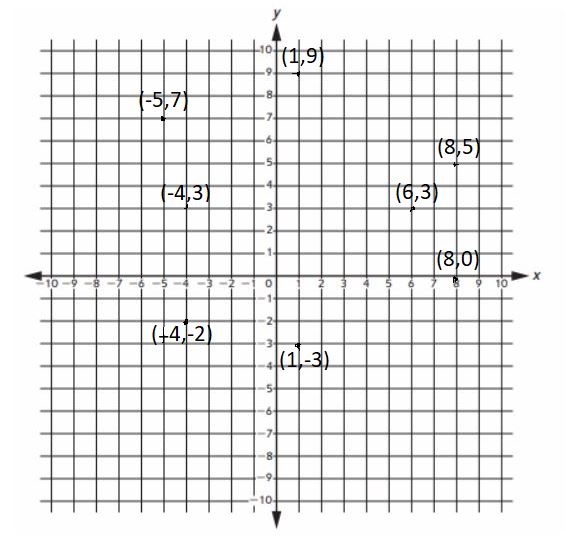
Question 1.
Plot the following points on the coordinate grid. Label each with its letter.
A: School: (8, 0)
B : Library: (8, 5)
C: Park: (1, -3)
D: Grocery store: (- 4, -2)
E: My house: (6, 3)
F: Post office: (1, 9)
G: Bank: (-5, 7)
H: Friend’s house: (-4, 3)
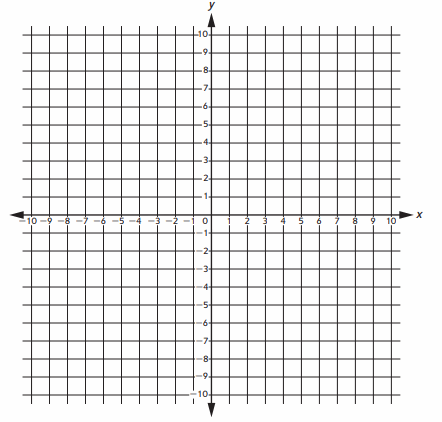
Answer:
Question 2.
You walk a straight line from your house to your friend’s house. Plot the point that is halfway between the two houses. Label this point M.
Write the ordered pair for point M. __
Answer :
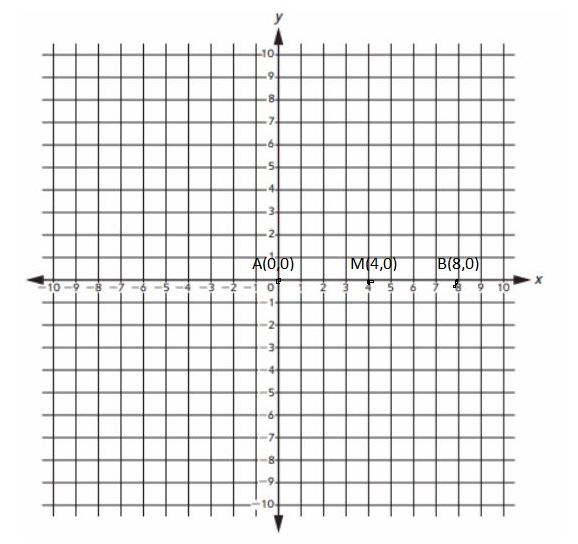
Explanation:
let A(0,0) be my house and B(8,0) be my friend’s house and the halfway between the two houses will be M(4,0)
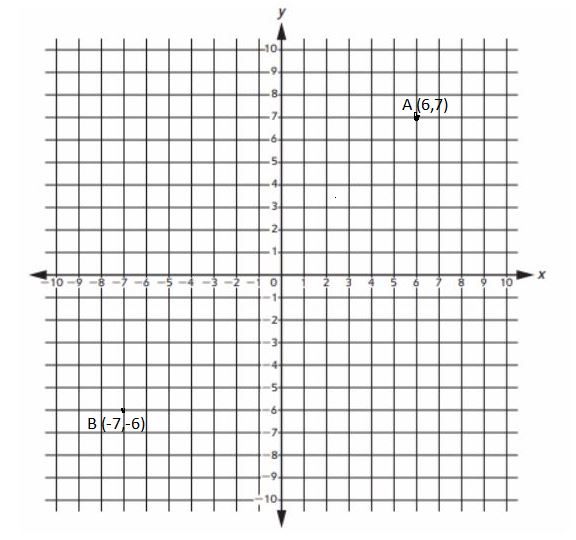
Question 3.
Plot and label two points on the coordinate grid. Place your points in different quadrants.
Letter: ___
Location : __
Ordered pair: ___
Letter: __
Location: __
Ordered pair: __
Answer :
Letter: A
Location : 1st Quadrant
Ordered pair: (6,7)
Letter: B
Location: 3rd Quadrant
Ordered pair: (-7,-6)
Explanation :
Question 4.
Explain how to plot the point (- 3, 5).
Explanation :
Find number -3 on X-axis and draw a perpendicular line to the X-axis from that point.
Find number 5 on Y-axis and draw a perpendicular line to the Y-axis from that point.
Now, mark the point where both lines meet. It is (-3,5).
Practice
List all of the factors
Question 5.
14 ________
Answer: 1,2,7,14
Question 6.
20 ________
Answer: 1,2,4,5,10,20
Question 7.
17 ________
Answer:1,17
Question 8.
32 ________
Answer: 1,2,4,8,16,32