Engage NY Eureka Math 8th Grade Module 6 Lesson 3 Answer Key
Eureka Math Grade 8 Module 6 Lesson 3 Example Answer Key
Example 1: Rate of Change and Initial Value Given in the Context of the Problem
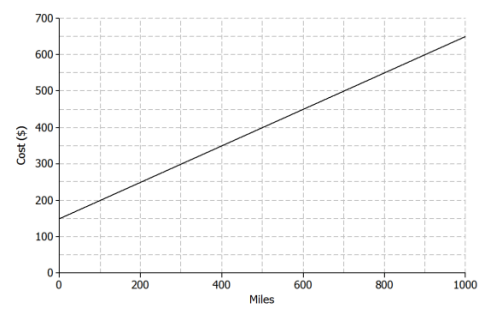
A truck rental company charges a $150 rental fee in addition to a charge of $0.50 per mile driven. Graph the linear function relating the total cost of the rental in dollars, C, to the number of miles driven, m, on the axes below.
Answer:
a. If the truck is driven 0 miles, what is the cost to the customer? How is this shown on the graph?
Answer:
$150, shown as the point (0, 150). This is the initial value. Some students might say “b.” Help them to use the term initial value.
b. What is the rate of change that relates cost to number of miles driven? Explain what it means within the context of the problem.
Answer:
The rate of change is 0.5. It means that the cost increases by $0.50 for every mile driven.
c. On the axes given, sketch the graph of the linear function that relates C to m.
Answer:
Students can plot the initial value (0, 150) and then use the rate of change to identify additional points as needed. A 1, 000-unit increase in m results in a 500-unit increase for C, so another point on the line is (1000, 650).
d. Write the equation of the linear function that models the relationship between number of miles driven and total rental cost.
Answer:
C = 0.5m + 150
Eureka Math Grade 8 Module 6 Lesson 3 Exercise Answer Key
Exercises
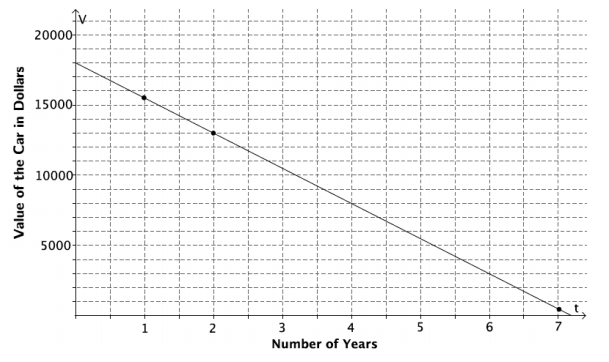
Jenna bought a used car for $18, 000. She has been told that the value of the car is likely to decrease by $2, 500 for each year that she owns the car. Let the value of the car in dollars be V and the number of years Jenna has owned the car be t.
Answer:
Exercise 1.
What is the value of the car when t = 0? Show this point on the graph.
Answer:
$18, 000. Shown by the point (0, 18000)
Exercise 2.
What is the rate of change that relates V to t? (Hint: Is it positive or negative? How can you tell?)
Answer:
-2, 500. The rate of change is negative because the value of the car is decreasing.
Exercise 3.
Find the value of the car when:
a. t = 1
Answer:
$18000 – $2500 = $15500
b. t = 2
Answer:
$18000 – 2($2500) = $13000
c. t = 7
Answer:
$18000 – 7($2500) = $500
Exercise 4.
Plot the points for the values you found in Exercise 3, and draw the line (using a straightedge) that passes through those points.
Answer:
See the graph above.
Exercise 5.
Write the linear function that models the relationship between the number of years Jenna has owned the car and the value of the car.
Answer:
V = 18000 – 2500t or V = -2500t + 18000
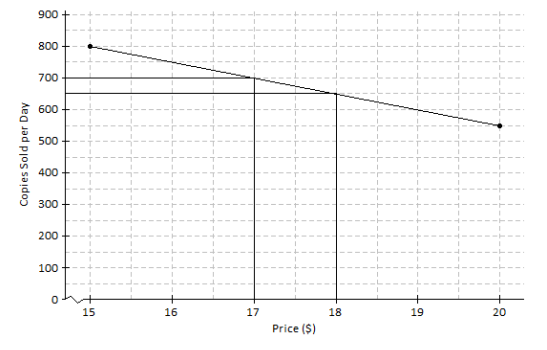
An online bookseller has a new book in print. The company estimates that if the book is priced at $15, then 800 copies of the book will be sold per day, and if the book is priced at $20, then 550 copies of the book will be sold per day.
Answer:
Exercise 6.
Identify the ordered pairs given in the problem. Then, plot both on the graph.
Answer:
The ordered pairs are (15, 800) and (20, 550). See the graph above.
Exercise 7.
Assume that the relationship between the number of books sold and the price is linear. (In other words, assume that the graph is a straight line.) Using a straightedge, draw the line that passes through the two points.
Answer:
See the graph above.
Exercise 8.
What is the rate of change relating number of copies sold to price?
Answer:
Between the points (15, 800) and (20, 550), the run is 5, and the rise is -(800-550) = -250. So, the rate of change is \(\frac{-250}{5}\) = -50.
Exercise 9.
Based on the graph, if the company prices the book at $18, about how many copies of the book can they expect to sell per day?
Answer:
650
Exercise 10.
Based on the graph, approximately what price should the company charge in order to sell 700 copies of the book per day?
Answer:
$17
Eureka Math Grade 8 Module 6 Lesson 3 Problem Set Answer Key
Question 1.
A plumbing company charges a service fee of $120, plus $40 for each hour worked. Sketch the graph of the linear function relating the cost to the customer (in dollars), C, to the time worked by the plumber (in hours), t, on the axes below.
Answer:
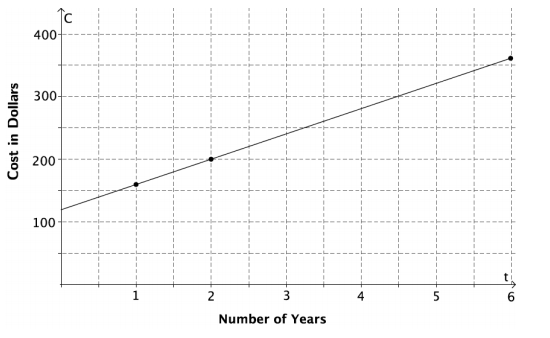
a. If the plumber works for 0 hours, what is the cost to the customer? How is this shown on the graph?
Answer:
$120 This is shown on the graph by the point (0, 120).
b. What is the rate of change that relates cost to time?
Answer:
40
c. Write a linear function that models the relationship between the hours worked and the cost to the customer.
Answer:
C = 40t + 120
d. Find the cost to the customer if the plumber works for each of the following number of hours.
i) 1 hour
Answer:
$160
ii) 2 hours
Answer:
$200
iii) 6 hours
Answer:
$360
e. Plot the points for these times on the coordinate plane, and use a straightedge to draw the line through the points.
Answer:
See the graph on the previous page.
Question 2.
An author has been paid a writer’s fee of $1, 000 plus $1.50 for every copy of the book that is sold.
a. Sketch the graph of the linear function that relates the total amount of money earned in dollars, A, to the number of books sold, n, on the axes below.
Answer:
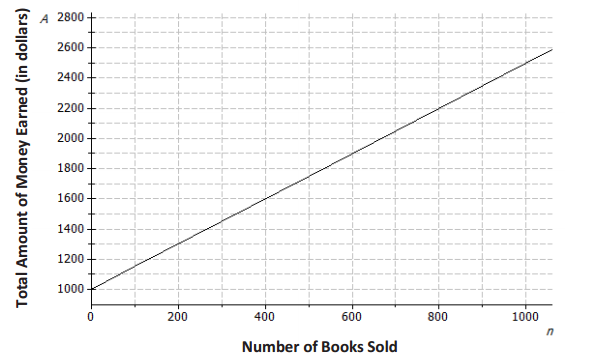
b. What is the rate of change that relates the total amount of money earned to the number of books sold?
Answer:
1.5
c. What is the initial value of the linear function based on the graph?
Answer:
1, 000
d. Let the number of books sold be n and the total amount earned be A. Construct a linear function that models the relationship between the number of books sold and the total amount earned.
Answer:
A = 1.5n + 1000
Question 3.
Suppose that the price of gasoline has been falling. At the beginning of last month (t = 0), the price was $4.60 per gallon. Twenty days later (t = 20), the price was $4.20 per gallon. Assume that the price per gallon, P, fell at a constant rate over the twenty days.
Answer:
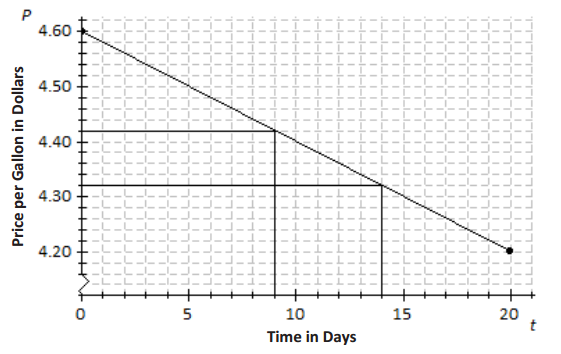
a. Identify the ordered pairs given in the problem. Plot both points on the coordinate plane above.
Answer:
(0, 4.60) and (20, 4.20); see the graph above.
b. Using a straightedge, draw the line that contains the two points.
Answer:
See the graph above.
c. What is the rate of change? What does it mean within the context of the problem?
Answer:
Using points (0, 4.60) and (20, 4.20), the rate of change is -0.02 because \(\frac{4.20-4.60}{20-0}\) = \(\frac{-0.4}{20}\) = -0.02. The price of gas is decreasing $0.02 each day.
d. What is the function that models the relationship between the number of days and the price per gallon?
Answer:
P = -0.02t + 4.6
e. What was the price of gasoline after 9 days?
Answer:
$4.42; see the graph above.
f. After how many days was the price $4.32?
Answer:
14 days; see the graph above.
Eureka Math Grade 8 Module 6 Lesson 3 Exit Ticket Answer Key
Question 1.
A car starts a journey with 18 gallons of fuel. Assuming a constant rate, the car consumes 0.04 gallon for every mile driven. Let A represent the amount of gas in the tank (in gallons) and m represent the number of miles driven.
Answer:
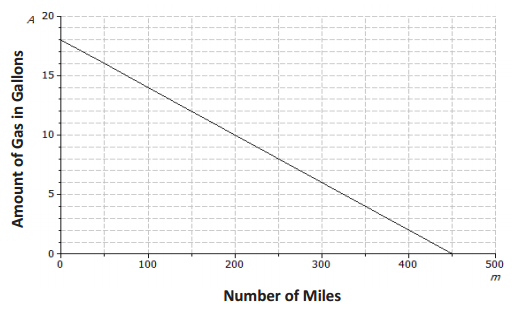
a. How much gas is in the tank if 0 miles have been driven? How would this be represented on the axes above?
Answer:
There are 18 gallons in the tank. This would be represented as (0, 18), the initial value, on the graph above.
b. What is the rate of change that relates the amount of gas in the tank to the number of miles driven? Explain what it means within the context of the problem.
Answer:
-0.04; the car consumes 0.04 gallon for every mile driven. It relates the amount of fuel to the miles driven.
c. On the axes above, draw the line that represents the graph of the linear function that relates A to m.
Answer:
See the graph above. Students can plot the initial value (0, 18) and then use the rate of change to identify additional points as needed. A 50-unit increase in m results in a 2-unit decrease for A, so another point on the line is (50, 16).
d. Write the linear function that models the relationship between the number of miles driven and the amount of gas in the tank.
Answer:
A = 18 – 0.04m or A = -0.04m + 18
Question 2.
Andrew works in a restaurant. The graph below shows the relationship between the amount Andrew earns in dollars and the number of hours he works.
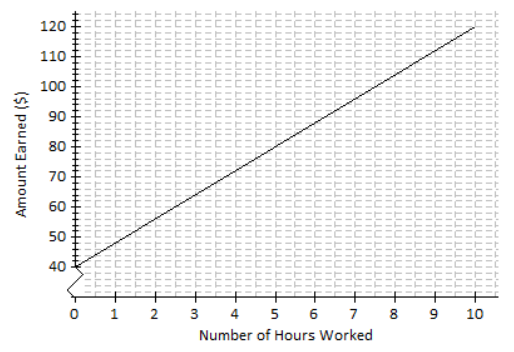
a. If Andrew works for 7 hours, approximately how much does he earn in dollars?
Answer:
$96
b. Estimate how long Andrew has to work in order to earn $64.
Answer:
3 hours
c. What is the rate of change of the function given by the graph? Interpret the value within the context of the problem.
Answer:
Using the ordered pairs (7, 96) and (3, 64), the slope is 8. It means that the amount Andrew earns increases by $8 for every hour worked.