Engage NY Eureka Math 8th Grade Module 6 Lesson 11 Answer Key
Eureka Math Grade 8 Module 6 Lesson 11 Exercise Answer Key
Exercise 1.
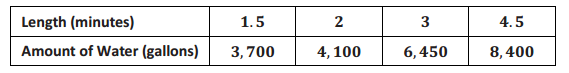
Old Faithful is a geyser in Yellowstone National Park. The following table offers some rough estimates of the length of an eruption (in minutes) and the amount of water (in gallons) in that eruption.
This data is consistent with actual eruption and summary statistics that can be found at the following links:
http://geysertimes.org/geyser.php?id = OldFaithful and http://www.yellowstonepark.com/2011/07/about – old – faithful/
a. Chang wants to predict the amount of water in an eruption based on the length of the eruption. What should he use as the dependent variable? Why?
Answer:
Since Chang wants to predict the amount of water in an eruption, the time length (in minutes) is the predictor, and the amount of water is the dependent variable.
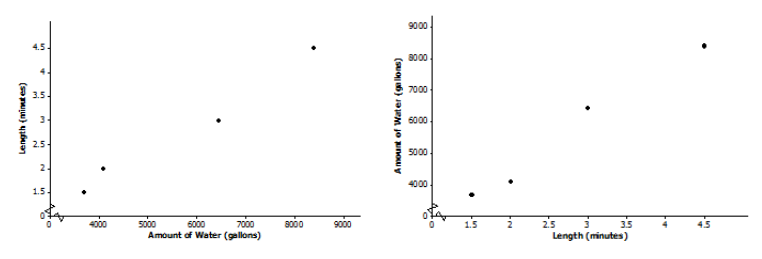
b. Which of the following two scatter plots should Chang use to build his prediction model? Explain.
Answer:
The predicted variable goes on the vertical axis with the predictor on the horizontal axis. So, the amount of water goes on the y – axis. The plot on the graph on the right should be used.
c. Suppose that Chang believes the variables to be linearly related. Use the first and last data points in the table to create a linear prediction model.
Answer:
m = \(\frac{84000 – 3700}{4.5 – 1.5}\)≈1,566.7
So, y = a + (1,566.7)x.
Using either (1.5,3700) or (4.5,8400) allows students to solve for the intercept. For example, solving 3,700 = a + (1,566.7)(1.5) for a yields a = 1,349.95, or rounded to 1,350.0 gallons. Be sure students talk through the units in each step of the calculations.
The (informal) linear prediction model is y = 1,350.0 + 1,566.7x. The amount of water (y) is in gallons, and the length of the eruption (x) is in minutes.
d. A friend of Chang’s told him that Old Faithful produces about 3,000 gallons of water for every minute that it erupts. Does the linear model from part (c) support what Chang’s friend said? Explain.
Answer:
This question requires students to interpret slope. An additional minute in eruption length results in a prediction of an additional 1,566.7 gallons of water produced. So, Chang’s friend who claims Old Faithful produces 3,000 gallons of water a minute must be thinking of a different geyser.
e. Using the linear model from part (c), does it make sense to interpret the y – intercept in the context of this problem? Explain.
Answer:
No, it doesn’t make sense because if the length of an eruption is 0, then it cannot produce 1,350 gallons of water. (Convey to students that some linear models have y – intercepts that do not make sense within the context of a problem.)
Exercise 2.
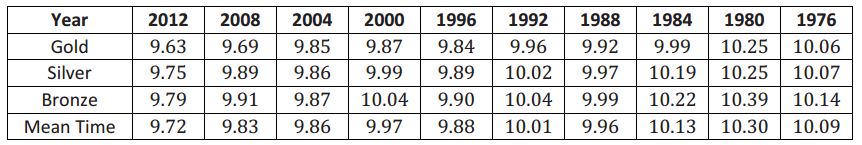
The following table gives the times of the gold, silver, and bronze medal winners for the men’s 100 – meter race (in seconds) for the past 10 Olympic Games.
Data Source: https://en.wikipedia.org/wiki/100_metres_at_the_Olympics#Men
a. If you wanted to describe how mean times change over the years, which variable would you use as the independent variable, and which would you use as the dependent variable?
Answer:
Mean medal time (dependent variable) is being predicted based on year (independent variable).
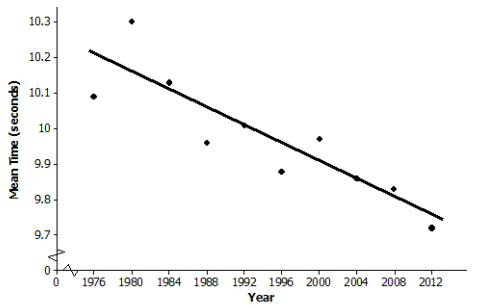
b. Draw a scatter plot to determine if the relationship between mean time and year appears to be linear. Comment on any trend or pattern that you see in the scatter plot.
Answer:
The scatter plot indicates a negative trend, meaning that, in general, the mean race times have been decreasing over the years even though there is not a perfect linear pattern.
c. One reasonable line goes through the 1992 and 2004 data. Find the equation of that line.
Answer:
The slope of the line through (1992,10.01) and (2004,9.86) is \(\frac{10.01 – 9.86}{1992 – 2004}\) = – 0.0125.
To find the intercept using (1992,10.01), solve 10.01 = a + ( – 0.0125)(1992) for a, which yields
a = 34.91.
The equation that predicts the mean medal race time for an Olympic year is y = 34.91 + ( – 0.0125)x.
The mean medal race time (y) is in seconds, and the time (x) is in years.
Note to Teacher: In Algebra I, students learn a formal method called least squares for determining a “best – fitting” line. For comparison, the least squares prediction line is y = 34.3562 + ( – 0.0122)x.
d. Before he saw these data, Chang guessed that the mean time of the three Olympic medal winners decreased by about 0.05 second from one Olympic Game to the next. Does the prediction model you found in part (c) support his guess? Explain.
Answer:
The slope – 0.0125 means that from one calendar year to the next, the predicted mean race time for the top three medals decreases by 0.0125 second. So, between successive Olympic Games, which occur every four years, the predicted mean race time is reduced by 0.05 second because 4(0.0125) = 0.05.
e. If the trend continues, what mean race time would you predict for the gold, silver, and bronze medal winners in the 2016 Olympic Games? Explain how you got this prediction.
Answer:
If the linear pattern were to continue, the predicted mean time for the 2016 Olympics is 9.71 seconds because 34.91 – (0.0125)(2016) = 9.71.
f. The data point (1980,10.3) appears to have an unusually high value for the mean race time (10.3). Using your library or the Internet, see if you can find a possible explanation for why that might have happened.
Answer:
The mean race time in 1980 was an unusually high 10.3 seconds. In their research of the 1980 Olympic Games, students find that the United States and several other countries boycotted the games, which were held in Moscow. Perhaps the field of runners was not the typical Olympic quality as a result. Atypical points in a set of data are called outliers. They may influence the analysis of the data.
Eureka Math Grade 8 Module 6 Lesson 11 Problem Set Answer Key
Question 1.
From the United States Bureau of Census website, the population sizes (in millions of people) in the United States for census years 1790–2010 are as follows.
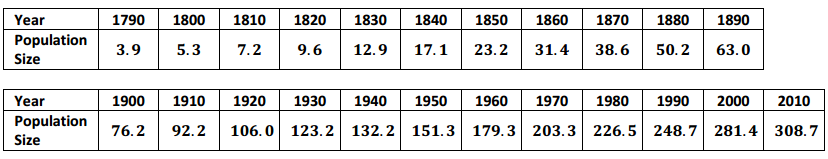
a. If you wanted to be able to predict population size in a given year, which variable would be the independent variable, and which would be the dependent variable?
Answer:
Population size (dependent variable) is being predicted based on year (independent variable).
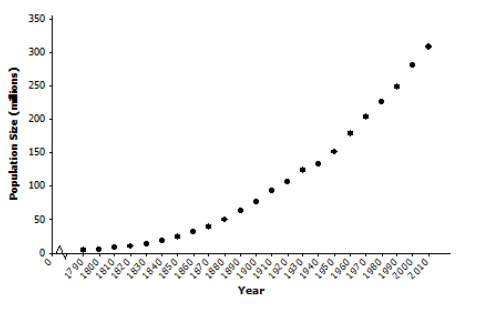
b. Draw a scatter plot. Does the relationship between year and population size appear to be linear?
Answer:
The relationship between population size and year of birth is definitely nonlinear. Note that investigating nonlinear relationships is the topic of the next two lessons.
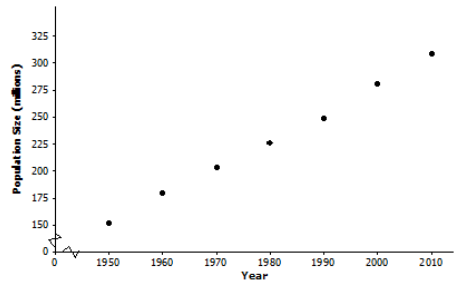
c. Consider the data only from 1950 to 2010. Does the relationship between year and population size for these years appear to be linear?
Answer:
Drawing a scatter plot using the 1950–2010 data indicates that the relationship between population size and year of birth is approximately linear, although some students may say that there is a very slight curvature to the data.
d. One line that could be used to model the relationship between year and population size for the data from 1950 to 2010 is y = – 4875.021 + 2.578x. Suppose that a sociologist believes that there will be negative consequences if population size in the United States increases by more than 2 \(\frac{3}{4}\) million people annually. Should she be concerned? Explain your reasoning.
Answer:
This problem is asking students to interpret the slope. Some students will no doubt say that the sociologist need not be concerned, since the slope of 2.578 million births per year is smaller than her threshold value of 2.75 million births per year. Other students may say that the sociologist should be concerned, since the difference between 2.578 and 2.75 is only 172,000 births per year.
e. Assuming that the linear pattern continues, use the line given in part (d) to predict the size of the population in the United States in the next census.
Answer:
The next census year is 2020.
– 4875.021 + (2.578)(2020) = 332.539
The given line predicts that the population then will be 332.539 million people.
Question 2.
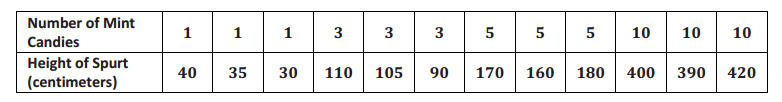
In search of a topic for his science class project, Bill saw an interesting YouTube video in which dropping mint candies into bottles of a soda pop caused the soda pop to spurt immediately from the bottle. He wondered if the height of the spurt was linearly related to the number of mint candies that were used. He collected data using 1, 3, 5, and 10 mint candies. Then, he used two – liter bottles of a diet soda and measured the height of the spurt in centimeters. He tried each quantity of mint candies three times. His data are in the following table.
a. Identify which variable is the independent variable and which is the dependent variable.
Answer:
Height of spurt is the dependent variable, and number of mint candies is the independent variable because height of spurt is being predicted based on number of mint candies used.
b. Draw a scatter plot that could be used to determine whether the relationship between height of spurt and number of mint candies appears to be linear.
Answer:
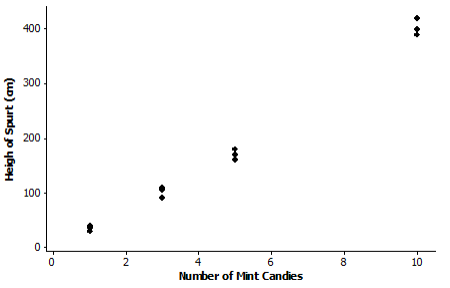
c. Bill sees a slight curvature in the scatter plot, but he thinks that the relationship between the number of mint candies and the height of the spurt appears close enough to being linear, and he proceeds to draw a line.
Answer:
His eyeballed line goes through the mean of the three heights for three mint candies and the mean of the three heights for 10 candies. Bill calculates the equation of his eyeballed line to be
y = – 27.617 + (43.095)x,
where the height of the spurt (y) in centimeters is based on the number of mint candies (x). Do you agree with this calculation? He rounded all of his calculations to three decimal places. Show your work.
Yes, Bill’s equation is correct.
The slope of the line through (3,101.667) and (10,403.333) is \(\frac{403.333 – 101.667}{10 – 3}\) = 43.095.
The intercept could be found by solving 403.333 = a + (43.095)(10) for a, which yields
a = – 27.617.
So, a possible prediction line is y = – 27.617 + (43.095)x.
d. In the context of this problem, interpret in words the slope and intercept for Bill’s line. Does interpreting the intercept make sense in this context? Explain.
Answer:
The slope is 43.095, which means that for every mint candy dropped into the bottle of soda pop, the height of the spurt increases by 43.095 cm.
The y – intercept is (0, – 27.617). This means that if no mint candies are dropped into the bottle of soda pop, the height of the spurt is – 27.617 ft. This does not make sense within the context of the problem.
e. If the linear trend continues for greater numbers of mint candies, what do you predict the height of the spurt to be if 15 mint candies are used?
Answer:
– 27.617 + (43.095)(15) = 618.808
The predicted height would be 618.808 cm, which is slightly over 20 ft.
Eureka Math Grade 8 Module 6 Lesson 11 Exit Ticket Answer Key
Question 1.
According to the Bureau of Vital Statistics for the New York City Department of Health and Mental Hygiene, the life expectancy at birth (in years) for New York City babies is as follows.

Data Source: http://www.nyc.gov/html/om/pdf/2012/pr465 – 12_charts.pdf
a. If you are interested in predicting life expectancy for babies born in a given year, which variable is the independent variable, and which is the dependent variable?
Answer:
Year of birth is the independent variable, and life expectancy in years is the dependent variable.
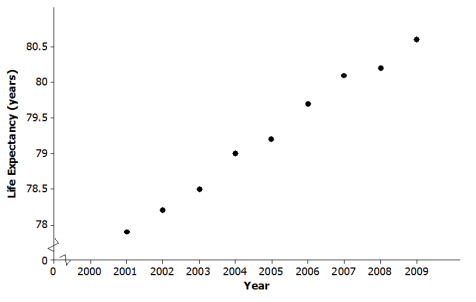
b. Draw a scatter plot to determine if there appears to be a linear relationship between the year of birth and life expectancy.
Answer:
Life expectancy and year of birth appear to be linearly related.
c. Fit a line to the data. Show your work.
Answer:
Answers will vary. For example, the line through (2001,77.9) and (2009,80.6) is y = – 597.438 + (0.3375)x, where life expectancy (y) is in years, and the time (x) is in years.
Note to Teacher: The formal least squares line (Algebra I) is y = – 612.458 + (0.345)x.
d. Based on the context of the problem, interpret in words the intercept and slope of the line you found in part (c).
Answer:
Answers will vary based on part (c). The intercept says that babies born in New York City in Year 0 should expect to live around – 597 years! Be sure students actually say that this is an unrealistic result and that interpreting the intercept is meaningless in this problem. Regarding the slope, for an increase of 1 in the year of birth, predicted life expectancy increases by 0.3375 year, which is a little over four months.
e. Use your line to predict life expectancy for babies born in New York City in 2010.
Answer:
Answers will vary based on part (c).
– 597.438 + (0.3375)(2010) = 80.9
Using the line calculated in part (c), the predicted life expectancy for babies born in New York City in 2010 is 80.9 years, which is also the value given on the website.