Engage NY Eureka Math 8th Grade Module 6 End of Module Assessment Answer Key
Eureka Math Grade 8 Module 6 End of Module Assessment Task Answer Key
Question 1.
The Kentucky Derby is a horse race held each year. The following scatter plot shows the speed of the winning horse at the Kentucky Derby each year between 1875 and 2012.
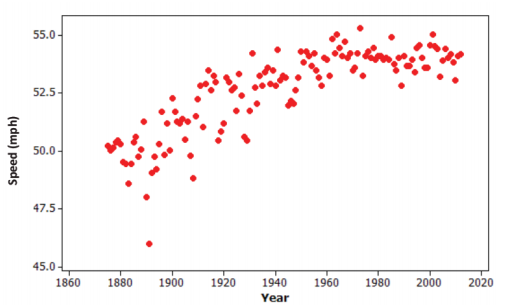
Data Source: http://www.kentuckyderby.com/
(Note: Speeds were calculated based on times given on website.)
a. Is the association between speed and year positive or negative? Give a possible explanation in the context of this problem for why the association behaves this way considering the variables involved.
Answer:
The association is positive overall, as horses have been getting faster over time. This is perhaps due to improved training methods.
b. Comment on whether the association between speed and year is approximately linear, and then explain in the context of this problem why the form of the association (linear or not) makes sense considering the variables involved.
Answer:
The association is not linear. There is probably a physical limit to how fast horses can go that we are approaching.
c. Circle an outlier in this scatter plot, and explain, in context, how and why the observation is unusual.
Answer:
The winner that year was much slower than we could have predicted.
Question 2.
Students were asked to report their gender and how many times a day they typically wash their hands. Of the 738 males, 66 said they wash their hands at most once a day, 583 said two to seven times per day, and 89 said eight or more times per day. Of the 204 females, 2 said they wash their hands at most once a day, 160 said two to seven times per day, and 42 said eight or more times per day.
a. Summarize these data in a two-way table with rows corresponding to the three different frequency-of-hand-washing categories and columns corresponding to gender.
Answer:
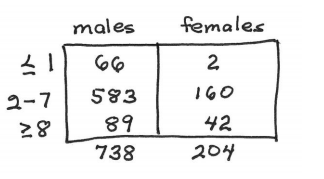
b. Do these data suggest an association between gender and frequency of hand washing? Support your answer with appropriate calculations.
Answer:
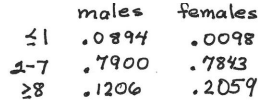
Males are more likely than females to wash hands at most once per day. Females are more likely to wash 8 or more times per day.
Question 3.
Basketball players who score a lot of points also tend to be strong in other areas of the game such as number of rebounds, number of blocks, number of steals, and number of assists. Below are scatter plots and linear models for professional NBA (National Basketball Association) players last season.
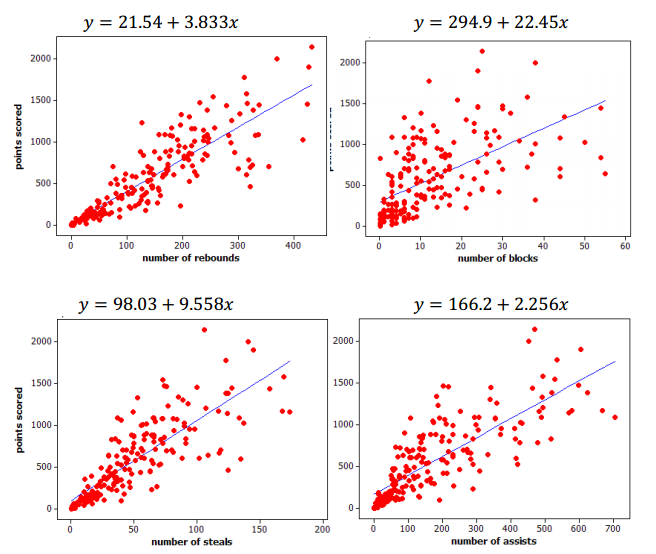
a. The line that models the association between points scored and number of rebounds is y = 21.54 + 3.833x, where y represents the number of points scored and x represents the number of rebounds. Give an interpretation, in context, of the slope of this line.
Answer:
If the number of rebounds increases by one, we predict the number of points increases by 3.833.
b. The equations on the previous page all show the number of points scored (y) as a function of the other variables. An increase in which of the variables (rebounds, blocks, steals, and assists) tends to have the largest impact on the predicted points scored by an NBA player?
Answer:
Each additional block corresponds to 22.45 more points, the largest slope or rate of increase.
c. Which of the four linear models shown in the scatter plots on the previous page has the worst fit to the data? Explain how you know using the data.
Answer:
Probably number of blocks because the association is weaker. There is more scatter of the points away from the line.