Engage NY Eureka Math 7th Grade Module 5 Lesson 7 Answer Key
Eureka Math Grade 7 Module 5 Lesson 7 Example Answer Key
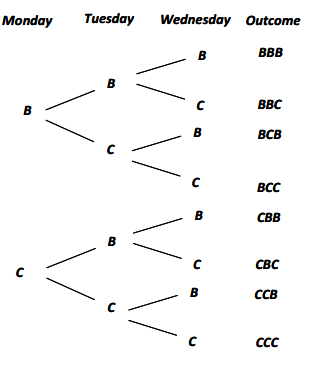
Example 1: Three Nights of Games
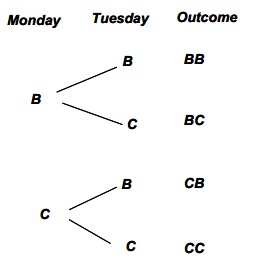
Recall a previous example where a family decides to play a game each night, and they all agree to use a tetrahedral die (a four-sided die in the shape of a pyramid where each of four possible outcomes is equally likely) each night to randomly determine if the game will be a board (B) or a card (C) game. The tree diagram mapping the possible overall outcomes over two consecutive nights was as follows:
But how would the diagram change if you were interested in mapping the possible overall outcomes over three consecutive nights? To accommodate this additional third stage, you would take steps similar to what you did before. You would attach all possibilities for the third stage (Wednesday) to each branch of the previous stage (Tuesday).
Answer:
Read through the example in the student lesson as a class. Convey the following important points about the tree diagram for this example:
The tree diagram is an important way of organizing and visualizing outcomes.
The tree diagram is particularly useful when the experiment can be thought of as occurring in stages.
When the information about probabilities associated with each branch is included, the tree diagram facilitates the computation of the probabilities of possible outcomes.
The basic principles of tree diagrams can apply to situations with more than two stages.
Example 2: Three Nights of Games (with Probabilities)
In Example 1, each night’s outcome is the result of a chance experiment (rolling the four-sided die). Thus, there is a probability associated with each night’s outcome.
By multiplying the probabilities of the outcomes from each stage, you can obtain the probability for each “branch of the tree.” In this case, you can figure out the probability of each of our eight outcomes.
For this family, a card game will be played if the die lands showing a value of 1, and a board game will be played if the die lands showing a value of 2, 3, or 4. This makes the probability of a board game (B) on a given night 0.75.
Let’s use a tree to examine the probabilities of the outcomes for the three days.
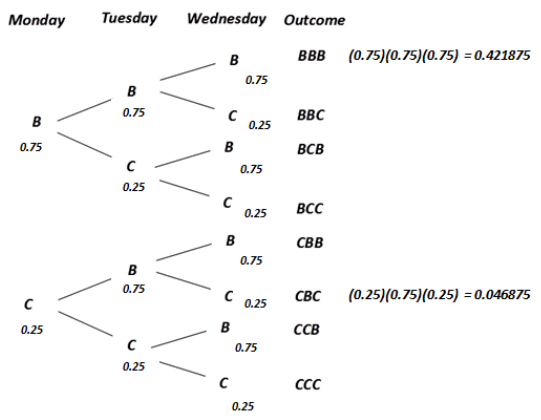
Answer:
Ask students:
→ What does CBC represent?
CBC represents the following sequence: card game the first night, board game the second night, and card game the third night.
→ The probability of CBC is approximately 0.046785. What does this probability mean?
The probability of CBC is very small. This means that the outcome of CBC is not expected to happen very often.
Eureka Math Grade 7 Module 5 Lesson 7 Exercise Answer Key
Exercises 1 – 3
Exercise 1.
If BBB represents three straight nights of board games, what does CBB represent?
Answer:
CBB would represent a card game on the first night and a board game on each of the second and third nights.
Exercise 2.
List all outcomes where exactly two board games were played over three days. How many outcomes were there?
Answer:
BBC, BCB, and CBB—there are 3 outcomes.
Exercise 3.
There are eight possible outcomes representing the three nights. Are the eight outcomes representing the three nights equally likely? Why or why not?
Answer:
As in the exercises of the previous lesson, the probability of C and B are not the same. As a result, the probability of the outcome CCC (all three nights involve card games) is not the same as BBB (all three nights playing board games). The probability of playing cards was only \(\frac{1}{4}\) in the previous lesson.
Exercises 4 – 6
Exercise 4.
Probabilities for two of the eight outcomes are shown. Calculate the approximate probabilities for the remaining six outcomes.
Answer:
BBC: 0.75(0.75)(0.25) = 0.140625
BCB: 0.75(0.25)(0.75) = 0.140625
BCC: 0.75(0.25)(0.25) = 0.046875
CBB: 0.25(0.75)(0.75) = 0.140625
CCB: 0.25(0.25)(0.75) = 0.046875
CCC: 0.25(0.25)(0.25) = 0.015625
Exercise 5.
What is the probability that there will be exactly two nights of board games over the three nights?
Answer:
The three outcomes that contain exactly two nights of board games are BBC, BCB, and CBB. The probability of exactly two nights of board games would be the sum of the probabilities of these outcomes, or
0.140625 + 0.140625 + 0.140625 = 0.421875.
Exercise 6.
What is the probability that the family will play at least one night of card games?
Answer:
This “at least” question could be answered by subtracting the probability of no card games (BBB) from 1. When you remove the BBB from the list of eight outcomes, the remaining outcomes include at least one night of card games. The probability of three nights of board games (BBB) is 0.421875. Therefore, the probability of at least one night of card games would be the probability of all outcomes (or 1) minus the probability of all board games, or
1 – 0.421875 = 0.578125.
Exercises 7 – 10: Three Children
A neighboring family just welcomed their third child. It turns out that all 3 of the children in this family are girls, and they are not twins or triplets. Suppose that for each birth, the probability of a boy birth is 0.5, and the probability of a girl birth is also 0.5. What are the chances of having 3 girls in a family’s first 3 births?
Exercise 7.
Draw a tree diagram showing the eight possible birth outcomes for a family with 3 children (no twins or triplets). Use the symbol B for the outcome of boy and G for the outcome of girl. Consider the first birth to be the first stage. (Refer to Example 1 if you need help getting started.)
Answer:
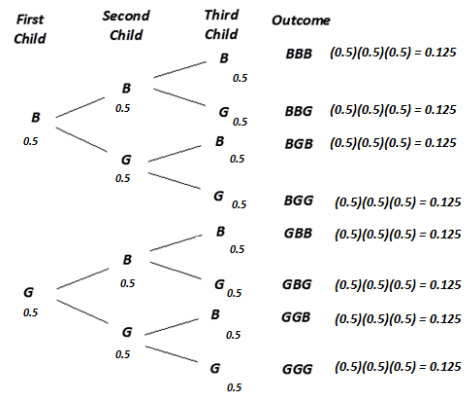
Exercise 8.
Write in the probabilities of each stage’s outcomes in the tree diagram you developed above, and determine the probabilities for each of the eight possible birth outcomes for a family with 3 children (no twins or triplets).
Answer:
In this case, since the probability of a boy is 0.5 and the probability of a girl is 0.5, each of the eight outcomes will have a probability of 0.125 of occurring.
Exercise 9.
What is the probability of a family having 3 girls in this situation? Is that greater than or less than the probability of having exactly 2 girls in 3 births?
Answer:
The probability of a family having 3 girls is 0.125. This is less than the probability of having exactly 2 girls in 3 births, which is 0.375 (the sum of the probabilities of GGB, GBG, and BGG). Note to teachers: Another way of explaining this to students is to point out that the probability of each outcome is the same, or 0.125. Therefore, the probability of 3 girls in 3 births is the probability of just one possible outcome. The probability of having exactly 2 girls in 3 births is the sum of the probabilities of three outcomes. Therefore, the probability of one of the outcomes is less than the probability of the sum of three outcomes (and again, emphasize that the probability of each outcome is the same).
Exercise 10.
What is the probability of a family of 3 children having at least 1 girl?
Answer:
The probability of having at least 1 girl would be found by subtracting the probability of no girls (or all boys, BBB) from 1, or 1-0.125 = 0.875.
Eureka Math Grade 7 Module 5 Lesson 7 Problem Set Answer Key
Question 1.
According to the Washington, D.C. Lottery’s website for its Cherry Blossom Double instant scratch game, the chance of winning a prize on a given ticket is about 17%. Imagine that a person stops at a convenience store on the way home from work every Monday, Tuesday, and Wednesday to buy a scratcher ticket and plays the game.
(Source: http://dclottery.com/games/scratchers/1223/cherry-blossom-doubler.aspx, accessed May 27, 2013)
a. Develop a tree diagram showing the eight possible outcomes of playing over these three days. Call stage one “Monday,” and use the symbols W for a winning ticket and L for a non-winning ticket.
b. What is the probability that the player will not win on Monday but will win on Tuesday and Wednesday?
c. What is the probability that the player will win at least once during the 3-day period?
Answer:
a.
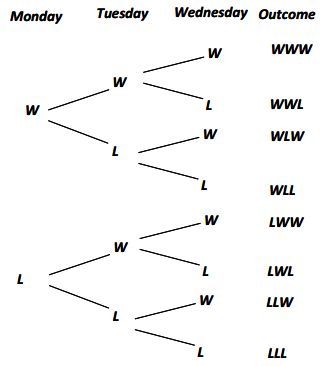
b. LWW outcome: 0.83(0.17)(0.17)≈0.024
c. “Winning at least once” would include all outcomes except LLL (which has a probability of approximately 0.5718). The probabilities of these outcomes would sum to about 0.4282.
This is also equal to 1-0.5718.
Question 2.
A survey company is interested in conducting a statewide poll prior to an upcoming election. They are only interested in talking to registered voters.
Imagine that 55% of the registered voters in the state are male and 45% are female. Also, consider that the distribution of ages may be different for each group. In this state, 30% of male registered voters are age 18 – 24, 37% are age 25 – 64, and 33% are 65 or older. 32% of female registered voters are age 18 – 24, 26% are age 25 – 64, and 42% are 65 or older.
The following tree diagram describes the distribution of registered voters. The probability of selecting a male registered voter age 18 – 24 is 0.165.
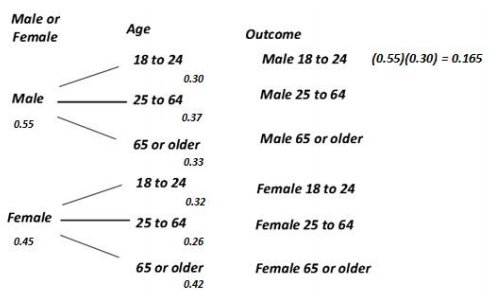
a. What is the chance that the polling company will select a registered female voter age 65 or older?
b. What is the chance that the polling company will select any registered voter age 18 – 24?
Answer:
a. Female 65 or older: (0.45)(0.42) = 0.189
b. The probability of selecting any registered voter age 18 – 24 would be the sum of the probability of selecting a male registered voter age 18 – 24 and the probability of selecting a female registered voter age 18 – 24.
(0.55)(0.30) = 0.165
(0.45)(0.32) = 0.144
0.165 + 0.144 = 0.309
The probability of selecting any voter age 18 – 24 is 0.309.
Eureka Math Grade 7 Module 5 Lesson 7 Exit Ticket Answer Key
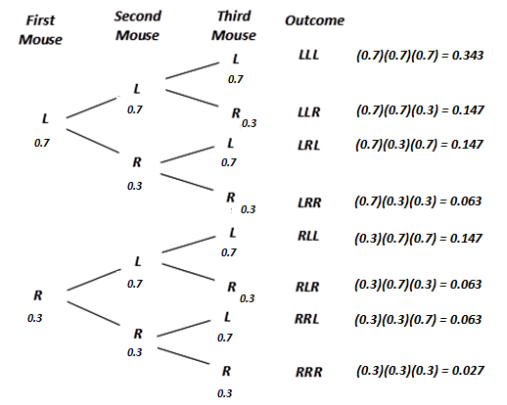
In a laboratory experiment, three mice will be placed in a simple maze that has just one decision point where a mouse can turn either left (L) or right (R). When the first mouse arrives at the decision point, the direction he chooses is recorded. The same is done for the second and the third mouse.
Question 1.
Draw a tree diagram where the first stage represents the decision made by the first mouse, the second stage represents the decision made by the second mouse, and so on. Determine all eight possible outcomes of the decisions for the three mice.
Answer:
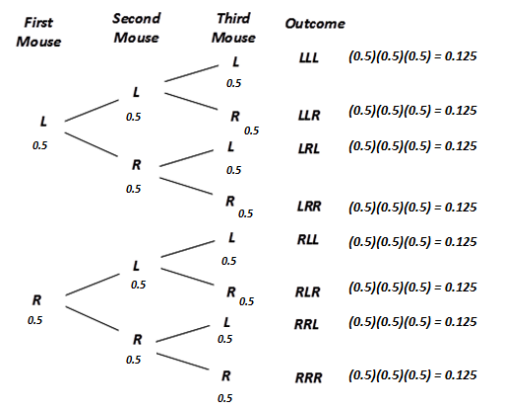
Question 2.
Use the tree diagram from Problem 1 to help answer the following question. If, for each mouse, the probability of turning left is 0.5 and the probability of turning right is 0.5, what is the probability that only one of the three mice will turn left?
Answer:
There are three outcomes that have exactly one mouse turning left: LRR, RLR, and RRL. Each has a probability of 0.125, so the probability of having only one of the three mice turn left is 0.375.
Question 3.
If the researchers conducting the experiment add food in the simple maze such that the probability of each mouse turning left is now 0.7, what is the probability that only one of the three mice will turn left? To answer the question, use the tree diagram from Problem 1.
Answer:
As in Problem 2, there are three outcomes that have exactly one mouse turning left: LRR, RLR, and RRL. However, with the adjustment made by the researcher, each of the three outcomes now has a probability of 0.063. So now, the probability of having only one of the three mice turn left is the sum of three equally likely outcomes of 0.063, or 0.063(3) = 0.189. The tree provides a way to organize the outcomes and the probabilities.