Engage NY Eureka Math 7th Grade Module 5 Lesson 4 Answer Key
Eureka Math Grade 7 Module 5 Lesson 4 Example Answer Key
Examples: Theoretical Probability
In a previous lesson, you saw that to find an estimate of the probability of an event for a chance experiment you divide
P(event) = \(\frac{\text { Number of observed occurrences of the event }}{\text { Total number of observations }}\)
Your teacher has a bag with some cubes colored yellow, green, blue, and red. The cubes are identical except for their color. Your teacher will conduct a chance experiment by randomly drawing a cube with replacement from the bag. Record the outcome of each draw in the table below.
Answer:
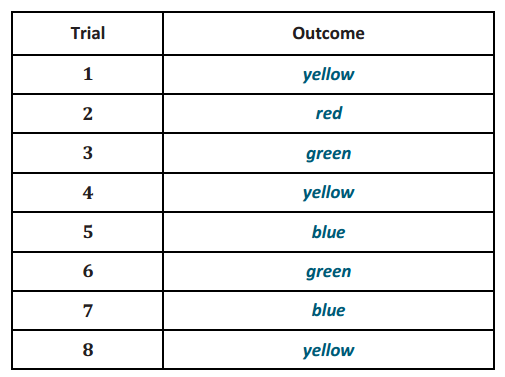
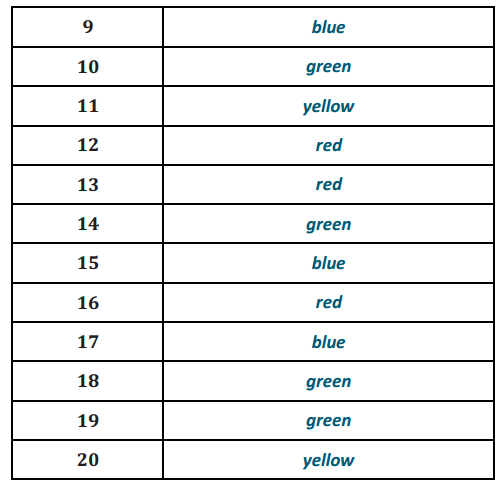
Example 1.
Based on the 20 trials, estimate for the probability of
a. Choosing a yellow cube
b. Choosing a green cube
c. Choosing a red cube
d. Choosing a blue cube
Answer:
a. Answers will vary but should be approximately \(\frac{5}{20}\), or \(\frac{1}{4}\). The probability in the sample provided is \(\frac{5}{20}\), or \(\frac{1}{4}\) .
b. Answers will vary but should be approximately \(\frac{5}{20}\), or \(\frac{1}{4}\). The probability in the sample provided is \(\frac{6}{20}\), or \(\frac{3}{10}\).
c. Answers will vary but should be approximately \(\frac{5}{20}\), or \(\frac{1}{4}\). The probability in the sample provided is \(\frac{4}{20}\), or \(\frac{1}{5}\).
d. Answers will vary but should be approximately \(\frac{5}{20}\), or \(\frac{1}{4}\). The probability in the sample provided is \(\frac{5}{20}\), or \(\frac{1}{4}\).
Example 2.
If there are 40 cubes in the bag, how many cubes of each color are in the bag? Explain.
Answer:
Answers will vary. Because the estimated probabilities are about the same for each color, we can predict that there are approximately the same number of each color of cube in the bag. Since an equal number of each color is estimated, approximately 10 of each color are predicted.
Example 3.
If your teacher were to randomly draw another 20 cubes one at a time and with replacement from the bag, would you see exactly the same results? Explain.
Answer:
No. This is an example of a chance experiment, so the results will vary.
Example 4.
Find the fraction of each color of cubes in the bag.
Yellow
Green
Red
Blue
Answer:
Yellow \(\frac{10}{40}\), or \(\frac{1}{4}\)
Green \(\frac{10}{40}\), or \(\frac{1}{4}\)
Red \(\frac{10}{40}\), or \(\frac{1}{4}\)
Blue \(\frac{10}{40}\), or \(\frac{1}{4}\)
Present the formal definition of the theoretical probability of an outcome when outcomes are equally likely. Then, ask
→ Why is the numerator of the fraction just 1?
Since the outcomes are equally likely, each one of the outcomes is just as likely as the other.
Define the word event as “a collection of outcomes.” Then, present that definition to students, and ask
→ Why is the numerator of the fraction not always 1?
Since there is a collection of outcomes, there may be more than one favorable outcome.
Use the cube example to explain the difference between an outcome and an event. Explain that each cube is equally likely to be chosen (an outcome), while the probability of drawing a blue cube (an event) is \(\frac{10}{40}\).
Each fraction is the theoretical probability of choosing a particular color of cube when a cube is randomly drawn from the bag.
When all the possible outcomes of an experiment are equally likely, the probability of each outcome is
P(outcome) = \(\frac{1}{\text { Number of possible outcomes }}\)
An event is a collection of outcomes, and when the outcomes are equally likely, the theoretical probability of an event can be expressed as
P(event) = \(\frac{\text { Number of favorable outcomes }}{\text { Number of possible outcomes }}\).
The theoretical probability of drawing a blue cube is
P(blue) = \(\frac{\text { Number of blue cubes }}{\text { Total number of cubes }}\) = \(\frac{10}{40}\).
Answer:
Example 5.
Is each color equally likely to be chosen? Explain your answer.
Answer:
Yes. There are the same numbers of cubes for each color.
Example 6.
How do the theoretical probabilities of choosing each color from Exercise 4 compare to the experimental probabilities you found in Exercise 1?
Answer:
Answers will vary.
Example 7.
An experiment consisted of flipping a nickel and a dime. The first step in finding the theoretical probability of obtaining a heads on the nickel and a heads on the dime is to list the sample space. For this experiment, complete the sample space below.
Nickel Dime
What is the probability of flipping two heads?
Answer:
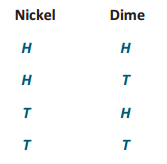
If the coins are fair, these outcomes are equally likely, so the probability of each outcome is \(\frac{1}{4}\).
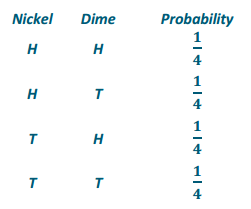
The probability of two heads is \(\frac{1}{4}\) or P(two heads) = \(\frac{1}{4}\).
Eureka Math Grade 7 Module 5 Lesson 4 Exercise Answer Key
Exercises 1–4
Exercise 1.
Consider a chance experiment of rolling a six-sided number cube with the numbers 1–6 on the faces.
a. What is the sample space? List the probability of each outcome in the sample space.
b. What is the probability of rolling an odd number?
c. What is the probability of rolling a number less than 5?
Answer:
a. Sample space: 1, 2, 3, 4, 5, 6
Probability of each outcome is \(\frac{1}{6}\).
b. \(\frac{3}{6}\), or \(\frac{1}{2}\)
c. \(\frac{4}{6}\), or \(\frac{2}{3}\)
Exercise 2.
Consider an experiment of randomly selecting a letter from the word number.
a. What is the sample space? List the probability of each outcome in the sample space.
b. What is the probability of selecting a vowel?
c. What is the probability of selecting the letter z?
Answer:
a. Sample space: n, u, m, b, e, r
Probability of each outcome is \(\frac{1}{6}\).
b. \(\frac{2}{6}\), or \(\frac{1}{3}\)
c. \(\frac{0}{6}\), or 0
Exercise 3.
Consider an experiment of randomly selecting a square from a bag of 10 squares.
a. Color the squares below so that the probability of selecting a blue square is \(\frac{1}{2}\).
b. Color the squares below so that the probability of selecting a blue square is \(\frac{4}{5}\).
Answer:
a. Five squares should be colored blue.
b. Eight squares should be colored blue.
Exercise 4.
Students are playing a game that requires spinning the two spinners shown below. A student wins the game if both spins land on red. What is the probability of winning the game? Remember to first list the sample space and the probability of each outcome in the sample space. There are eight possible outcomes to this chance experiment.
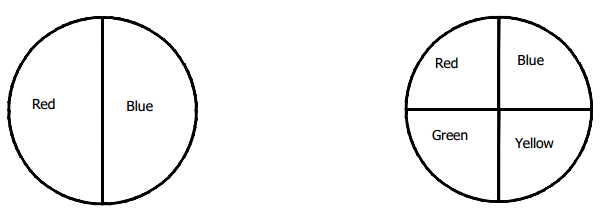
Answer:
Sample space: R1 R2, R1 B2, R1 G2, R1 Y2, B1 R2, B1 B2, B1 G2, B1 Y2
Each outcome has a probability of \(\frac{1}{8}\).
Probability of a win (both red) is\(\frac{1}{8}\).
Eureka Math Grade 7 Module 5 Lesson 4 Problem Set Answer Key
Question 1.
In a seventh-grade class of 28 students, there are 16 girls and 12 boys. If one student is randomly chosen to win a prize, what is the probability that a girl is chosen?
Answer:
\(\frac{16}{28}\), or \(\frac{4}{7}\)
Question 2.
An experiment consists of spinning the spinner once.
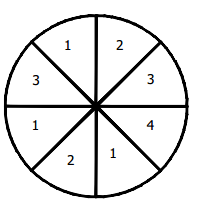
a. Find the probability of landing on a 2.
b. Find the probability of landing on a 1.
c. Is landing in each section of the spinner equally likely to occur? Explain.
Answer:
a. \(\frac{2}{8}\), or \(\frac{1}{4}\)
b. \(\frac{3}{8}\)
c. Yes. Each section is the same size.
Question 3.
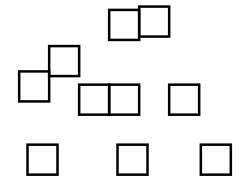
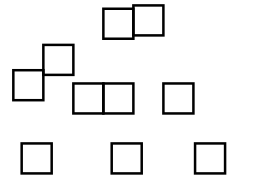
An experiment consists of randomly picking a square section from the board shown below.
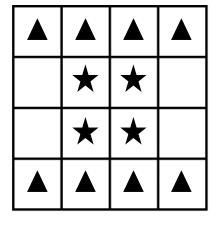
a. Find the probability of choosing a triangle.
b. Find the probability of choosing a star.
c. Find the probability of choosing an empty square.
d. Find the probability of choosing a circle.
Answer:
a. \(\frac{8}{16}\), or \(\frac{1}{2}\)
b. \(\frac{4}{16}\), or \(\frac{1}{4}\)
c. \(\frac{4}{16}\), or \(\frac{1}{4}\)
d. \(\frac{0}{16}\), or 0
Question 4.
Seventh graders are playing a game where they randomly select two integers 0–9, inclusive, to form a two-digit number. The same integer might be selected twice.
a. List the sample space for this chance experiment. List the probability of each outcome in the sample space.
b. What is the probability that the number formed is between 90 and 99, inclusive?
c. What is the probability that the number formed is evenly divisible by 5?
d. What is the probability that the number formed is a factor of 64?
Answer:
a. Sample space: Numbers 00–99 Probability of each outcome is \(\frac{1}{100}\).
b. \(\frac{10}{100}\), or \(\frac{1}{10}\)
c. \(\frac{20}{100}\), or \(\frac{1}{5}\)
d. \(\frac{7}{100}\) (Factors of 64 are 1, 2, 4, 8, 16, 32, and 64.)
Question 5.
A chance experiment consists of flipping a coin and rolling a number cube with the numbers 1–6 on the faces of the cube.
a. List the sample space of this chance experiment. List the probability of each outcome in the sample space.
b. What is the probability of getting a heads on the coin and the number 3 on the number cube?
c. What is the probability of getting a tails on the coin and an even number on the number cube?
Answer:
a. Sample space: H1, H2, H3, H4, H5, H6, T1, T2, T3, T4, T5, T6 The probability of each outcome is \(\frac{1}{12}\).
b. \(\frac{1}{12}\)
c. \(\frac{3}{12}\), or \(\frac{1}{4}\)
Question 6.
A chance experiment consists of spinning the two spinners below.
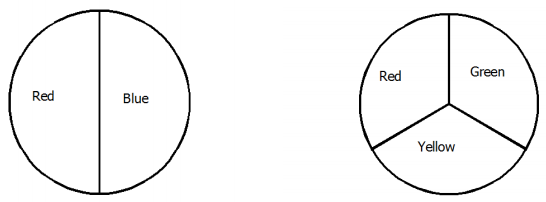
a. List the sample space and the probability of each outcome.
b. Find the probability of the event of getting a red on the first spinner and a red on the second spinner.
c. Find the probability of a red on at least one of the spinners.
Answer:
a. Sample space: R1 R2, R1 G2, R1 Y2, B1 R2, B1 G2, B1 Y2 Each outcome has a probability of \(\frac{1}{6}\).
b. \(\frac{1}{6}\)
c. \(\frac{4}{6}\), or \(\frac{2}{3}\)
Eureka Math Grade 7 Module 5 Lesson 4 Exit Ticket Answer Key
An experiment consists of randomly drawing a cube from a bag containing three red and two blue cubes.
Question 1.
What is the sample space of this experiment?
Answer:
Red, blue
Question 2.
List the probability of each outcome in the sample space.
Answer:
Probability of red is \(\frac{3}{5}\). Probability of blue is \(\frac{2}{5}\).
Question 3.
Is the probability of selecting a red cube equal to the probability of selecting a blue cube? Explain.
Answer:
No. There are more red cubes than blue cubes, so red has a greater probability of being chosen.