Engage NY Eureka Math 7th Grade Module 5 Lesson 23 Answer Key
Eureka Math Grade 7 Module 5 Lesson 23 Example Answer Key
Example 1: Texting
With texting becoming so popular, Linda wanted to determine if middle school students memorize real words more or less easily than fake words. For example, real words are food, car, study, swim; whereas fake words are stk, fonw, cqur, ttnsp. She randomly selected 28 students from all middle school students in her district and gave half of them a list of 20 real words and the other half a list of 20 fake words.
a. How do you think Linda might have randomly selected 28 students from all middle school students in her district?
Answer:
Random selection is done in an attempt to obtain students to represent all middle school students in the district. Linda would need to number all middle school students and use a random device to generate
28 numbers. One device to generate integers is http://www.rossmanchance.com/applets/RandomGen/GenRandom01.htm. Note that if there are duplicates, additional random numbers need to be generated. A second way to generate the random selections is by using the random number table provided in previous lessons.
b. Why do you think Linda selected the students for her study randomly? Explain.
Answer:
Linda randomly assigned her chosen 28 students to two groups of 14 each. Random assignment is done to help ensure that groups are similar to each other.
c. She gave the selected students one minute to memorize their lists, after which they were to turn the lists over and, after two minutes, write down all the words that they could remember. Afterward, they calculated the number of correct words that they were able to write down. Do you think a penalty should be given for an incorrect word written down? Explain your reasoning.
Answer:
Answers will vary. Either position is acceptable. The purpose is to get students to take a position and argue for it.
Example 2.
Ken, an eighth-grade student, was interested in doing a statistics study involving sixth-grade and eleventh-grade students in his school district. He conducted a survey on four numerical variables and two categorical variables (grade level and gender). His Excel population database for the 265 sixth graders and 175 eleventh graders in his district has the following description:
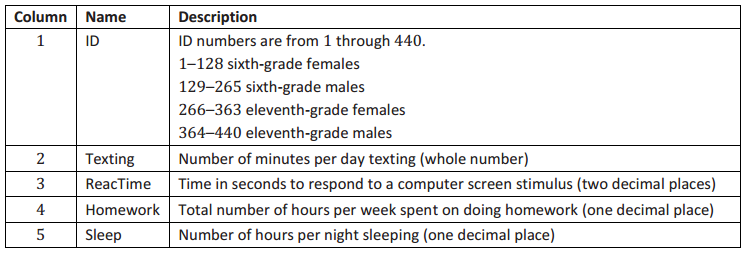
a. Ken decides to base his study on a random sample of 20 sixth graders and a random sample of 20 eleventh graders. The sixth graders have IDs 1–265, and the eleventh graders are numbered 266–440. Advise him on how to randomly sample 20 sixth graders and 20 eleventh graders from his data file.
Answer:
Ken should first number the sixth graders from 1 to 265 and the eleventh graders from 266 to 440. Then, Ken can choose 20 different random integers from 1to 265 for the sixth-grade participants and 20 different random integers from 266 to 440 for the eleventh graders.
Suppose that from a random number generator:
The random ID numbers for Ken’s 20 sixth graders: 231 15 19 206 86 183 233 253 142 36 195 139 75 210 56 40 66 114 127 9
The random ID numbers for his 20 eleventh graders: 391 319 343 426 307 360 289 328 390 350 279 283 302 287 269 332 414 267 428 280
b. For each set, find the homework hours data from the population database that correspond to these randomly selected ID numbers.
Answer:
Sixth graders’ IDs ordered: 9 15 19 36 40 56 66 75 86 114 127 139 142 183 195 206 210 231 233 253
Their data: 8.4 7.2 9.2 7.9 9.3 7.6 6.5 6.7 8.2 7.7 7.7 4.8 5.4 4.7 7.1 6.6 2.9 8.5 6.1 8.6
Eleventh graders’ IDs ordered: 267 269 279 280 283 287 289 302 307 319 328 332 343 350 360 390 391 414 426 428
Their data:
9.5 9.8 10.9 11.8 10.0 12.0 9.1 11.8 10.0 8.3 10.6 9.5 9.8 10.8 10.7 9.4 13.2 7.3 11.6 10.3
c. On the same scale, draw dot plots for the two sample data sets.
Answer:
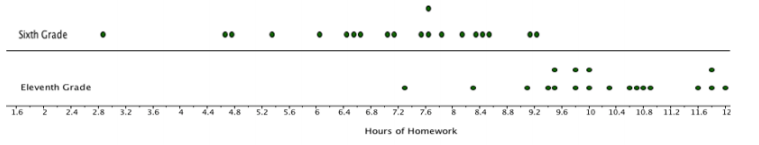
d. From looking at the dot plots, list some observations comparing the number of hours per week that sixth graders spend on doing homework and the number of hours per week that eleventh graders spend on doing homework.
Answer:
There is some overlap between the data for the two random samples. The sixth-grade distribution may be slightly skewed to the left. The eleventh-grade distribution is fairly symmetric. The mean number of homework hours for sixth graders appears to be around 7 hours, whereas that for the eleventh graders is around 10.
e. Calculate the mean and MAD for each of the data sets. How many MADs separate the two sample means? (Use the larger MAD to make this calculation if the sample MADs are not the same.)
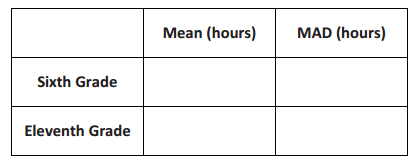
Answer:
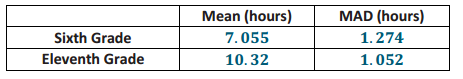
The number of MADs that separate the two means is \(\frac{10.32-7.055}{1.274}\), or 2.56.
f. Ken recalled Linda suggesting that if the number of MADs is greater than or equal to 2, then it would be reasonable to think that the population of all sixth-grade students in his district and the population of all eleventh-grade students in his district have different means. What should Ken conclude based on his homework study?
Answer:
Since 2.56 is greater than 2, it is reasonable to conclude that on average eleventh graders spend more time doing homework per week than do sixth graders.
Eureka Math Grade 7 Module 5 Lesson 23 Exercise Answer Key
Exercises 1–4
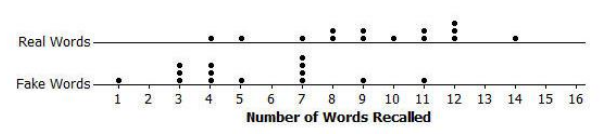
Suppose the data (the number of correct words recalled) she collected were as follows:
For students given the real words list: 8,11,12,8,4,7,9,12,12,9,14,11,5,10
For students given the fake words list: 3,5,4,4,4,7,11,9,7,7,1,3,3,7
Exercise 1.
On the same scale, draw dot plots for the two data sets.
Answer:
Exercise 2.
From looking at the dot plots, write a few sentences comparing the distribution of the number of correctly recalled real words with the distribution of the number of correctly recalled fake words. In particular, comment on which type of word, if either, that students recall better. Explain.
Answer:
There is a considerable amount of overlap between data from the two random samples. The distribution of the number of real words recalled is somewhat skewed to the left; the distribution of the number of fake words recalled is fairly symmetric. The real words distribution appears to be centered around 9 or 10, whereas the fake words distribution appears to be centered around 6. Whether the separation between 9 and 6 is meaningful remains to be seen. If it is meaningful, then the mean number of real words recalled is greater than the mean number of fake words recalled.
Exercise 3.
Linda made the following calculations for the two data sets:
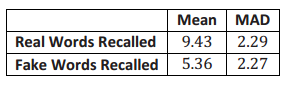
In the previous lesson, you calculated the number of MADs that separated two sample means. You used the larger MAD to make this calculation if the two MADs were not the same. How many MADs separate the mean number of real words recalled and the mean number of fake words recalled for the students in the study?
Answer:
The difference between the two means is 9.43 – 5.36 = 4.07. The larger of the two MADs is 2.29. The number of MADs that separate the two means is \(\frac{4.07}{2.29}\), or 1.78.
Exercise 4.
In the last lesson, our work suggested that if the number of MADs that separate the two sample means is 2 or more, then it is reasonable to conclude that not only do the means differ in the samples but that the means differ in the populations as well. If the number of MADs is less than 2, then you can conclude that the difference in the sample means might just be sampling variability and that there may not be a meaningful difference in the population means. Using these criteria, what can Linda conclude about the difference in population means based on the sample data that she collected? Be sure to express your conclusion in the context of this problem.
Answer:
Since 1.78 is below the suggested 2 MADs, Linda would conclude that the average number of real words that all middle school students in her district would recall might be the same as the average number of fake words that they would recall.
Eureka Math Grade 7 Module 5 Lesson 23 Problem Set Answer Key
Question 1.
Based on Ken’s population database, compare the amount of sleep that sixth-grade females get on average to the amount of sleep that eleventh-grade females get on average.
Find the data for 15 sixth-grade females based on the following random ID numbers: 65 1 67 101 106 87 85 95 120 4 64 74 102 31 128
Find the data for 15 eleventh-grade females based on the following random ID numbers:
348 313 297 351 294 343 275 354 311 328 274 305 288 267 301
Answer:
This problem compares the amount of sleep that sixth-grade females get on average to the amount of sleep that eleventh-grade females get on average.
(Note to teachers: Random numbers are provided for students. Provide students access to the data file (a printed copy or access to the file at the website), or if that is not possible, provide them the following values to use in the remaining questions.)
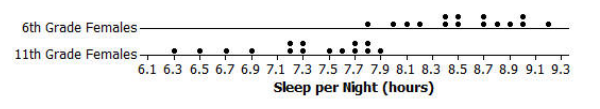
Sixth-grade females’ number of hours of sleep per night: 8.2 7.8 8.0 8.1 8.7 9.0 8.9 8.7 8.4 9.0 8.4 8.5 8.8 8.5 9.2
Eleventh-grade females’ number of hours of sleep per night: 6.9 7.8 7.2 7.9 7.8 6.7 7.6 7.3 7.7 7.3 6.5 7.7 7.2 6.3 7.5
Question 2.
On the same scale, draw dot plots for the two sample data sets.
Answer:
Question 3.
Looking at the dot plots, list some observations comparing the number of hours per week that sixth graders spend on doing homework and the number of hours per week that eleventh graders spend on doing homework.
Answer:
There is a small amount of overlap between the data sets for the two random samples. The distribution of sixth-grade hours of sleep is symmetric, whereas that for eleventh graders is skewed to the left. It appears that the mean number of hours of sleep for sixth-grade females is around 8.5, and the mean number for eleventh-grade females is around 7.3 or so. Whether or not the difference is meaningful depends on the amount of variability that separates them.
Question 4.
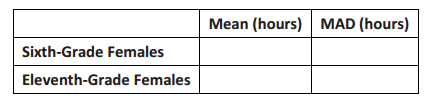
Calculate the mean and MAD for each of the data sets. How many MADs separate the two sample means? (Use the larger MAD to make this calculation if the sample MADs are not the same.)
Answer:
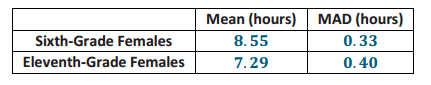
The number of MADs that separate the two means is \(\frac{8.55-7.29}{0.4}\), or 3.15.
Question 5.
Recall that if the number of MADs in the difference of two sample means is greater than or equal to 2, then it would be reasonable to think that the population means are different. Using this guideline, what can you say about the average number of hours of sleep per night for all sixth-grade females in the population compared to all eleventh-grade females in the population?
Answer:
Since 3.15 is well above the criteria of 2 MADs, it can be concluded that on average sixth-grade females get more sleep per night than do eleventh-grade females.
Eureka Math Grade 7 Module 5 Lesson 23 Exit Ticket Answer Key
Question 1.
Do eleventh-grade males text more per day than eleventh-grade females do? To answer this question, two randomly selected samples were obtained from the Excel data file used in this lesson. Indicate how 20 randomly selected eleventh-grade females would be chosen for this study. Indicate how 20 randomly selected eleventh-grade males would be chosen.
Answer:
To pick 20 females, 20 randomly selected numbers from 266 to 363 would be generated from a random number generator or from a random number table. Duplicates would be disregarded, and a new number would be generated. To pick 20 males, 20 randomly selected numbers from 264 to 440 would be generated. Again, duplicates would be disregarded, and a new number would be generated.
Question 2.
Two randomly selected samples (one of eleventh-grade females and one of eleventh-grade males) were obtained from the database. The results are indicated below:
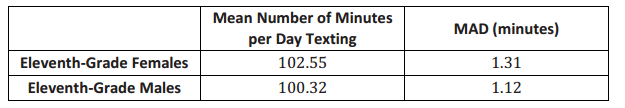
Is there a meaningful difference in the number of minutes per day that eleventh-grade females and males text? Explain your answer.
Answer:
The difference in the means is 02.55 min. – 100.32 min., or 2.23 min. (to the nearest hundredth of a minute). Divide this by 1.31 min. or the MAD for females (the larger of the two MADs): \(\frac{2.23}{1.31}\), or 1.70 to the nearest hundredth. This difference is less than 2 MADs, and therefore, the difference in the male and female number of minutes per day of texting is not a meaningful difference.