Engage NY Eureka Math 7th Grade Module 5 Lesson 18 Answer Key
Eureka Math Grade 7 Module 5 Lesson 18 Example Answer Key
Example 1: Sampling Variability
The previous lesson investigated the statistical question “What is the typical time spent at the gym?” by selecting random samples from the population of 800 gym members. Two different dot plots of sample means calculated from random samples from the population are displayed below. The first dot plot represents the means of 20 samples with each sample having 5 data points. The second dot plot represents the means of 20 samples with each sample having 15 data points.
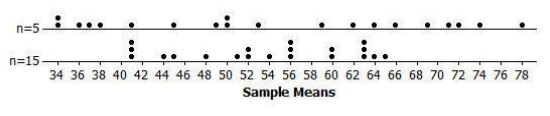
Based on the first dot plot, Jill answered the statistical question by indicating the mean time people spent at the gym was between 34 and 78 minutes. She decided that a time approximately in the middle of that interval would be her estimate of the mean time the 800 people spent at the gym. She estimated 52 minutes. Scott answered the question using the second dot plot. He indicated that the mean time people spent at the gym was between 41 and 65 minutes. He also selected a time of 52 minutes to answer the question.
a. Describe the differences in the two dot plots.
Answer:
The first dot plot shows a greater variability in the sample means than the second dot plot.
b. Which dot plot do you feel more confident in using to answer the statistical question? Explain your answer.
Answer:
Possible response: The second dot plot gives me more confidence because the sample means do not differ as much from one another. They are more tightly clustered, so I think I have a better idea of where the population mean is located.
c. In general, do you want sampling variability to be large or small? Explain.
Answer:
The larger the sampling variability, the more that the value of a sample statistic varies from one sample to another and the farther you can expect a sample statistic value to be from the population characteristic. You want the value of the sample statistic to be close to the population characteristic. So, you want sampling variability to be small.
Eureka Math Grade 7 Module 5 Lesson 18 Exercise Answer Key
Exercises 1–3
In the previous lesson, you saw a population of 800 times spent at the gym. You will now select a random sample of size 15 from that population. You will then calculate the sample mean.
Exercise 1.
Start by selecting a three-digit number from the table of random digits. Place the random digit table in front of you. Without looking at the page, place the eraser end of your pencil somewhere on the table of random digits. Start using the table of random digits at the digit closest to your eraser. This digit and the following two specify which observation from the population will be the first observation in your sample. Write the value of this observation in the space below. (Discard any three-digit number that is 800 or larger, and use the next three digits from the random digit table.)
Answer:
Answers will vary.
Exercise 2.
Continue moving to the right in the table of random digits from the point that you reached in Exercise 1. Each three-digit number specifies a value to be selected from the population. Continue in this way until you have selected 14 more values from the population. This will make 15 values altogether. Write the values of all 15 observations in the space below.
Answer:
Answers will vary.
Exercise 3.
Calculate the mean of your 15 sample values. Write the value of your sample mean below. Round your answer to the nearest tenth. (Be sure to show your work.)
Answer:
Answers will vary.
Exercises 4–6
You will now use the sample means from Exercise 3 for the entire class to make a dot plot.
Exercise 4.
Write the sample means for everyone in the class in the space below.
Answer:
Answers will vary.
Exercise 5.
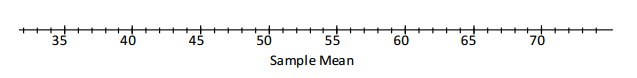
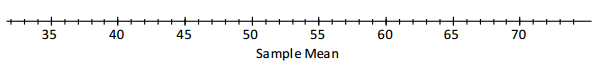
Use all the sample means to make a dot plot using the axis given below. (Remember, if you have repeated values or values close to each other, stack the dots one above the other.)
Answer:
Answers will vary.
Exercise 6.
In the previous lesson, you drew a dot plot of sample means for samples of size 5. How does the dot plot above
(of sample means for samples of size 15) compare to the dot plot of sample means for samples of size 5? For which sample size (5 or 15) does the sample mean have the greater sampling variability?
This exercise illustrates the notion that the greater the sample size, the smaller the sampling variability of the sample mean.
Answer:
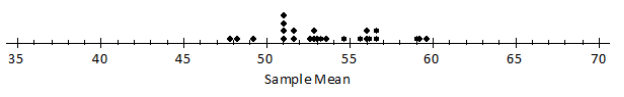
The dot plots will vary depending on the results of the random sampling. Dot plots for one set of sample means for 20 random samples of size 5 and for 20 random samples of size 15 are shown below. The main thing for students to notice is that there is less variability from sample to sample for the larger sample size.
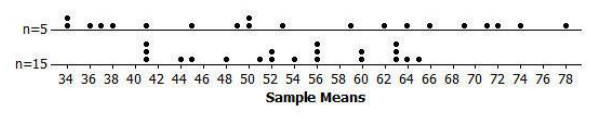
This exercise illustrates the notion that the greater the sample size, the smaller the sampling variability of the sample mean.
Exercises 7–8
Exercise 7.
Remember that in practice you only take one sample. Suppose that a statistician plans to take a random sample of size 15 from the population of times spent at the gym and will use the sample mean as an estimate of the population mean. Based on the dot plot of sample means that your class collected from the population, approximately how far can the statistician expect the sample mean to be from the population mean? (The actual population mean is 53.9 minutes.)
Answer:
Answers will vary according to the degree of variability that appears in the dot plot and a student’s estimate of an average distance from the population mean. Allow students to use an approximation of 54 minutes for the population mean. In the example above, the 20 samples could be used to estimate the mean distance of the sample means to the population mean of 54 minutes.
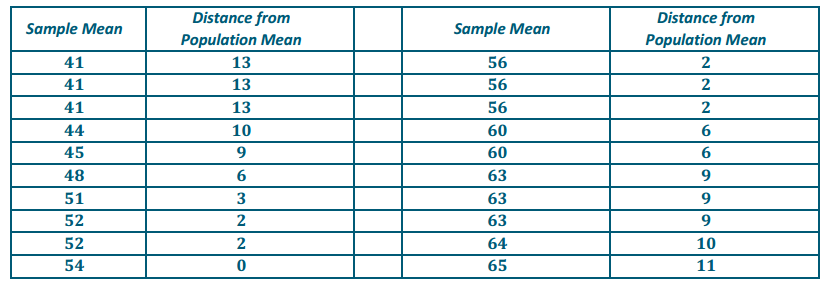
The sum of the distances from the mean in the above example is 137. The mean of these distances, or the expected distance of a sample mean from the population mean, is 6.85 minutes.
Exercise 8.
How would your answer in Exercise 7 compare to the equivalent mean of the distances for a sample of size 5?
Answer:
Sample response: My answer for Exercise 7 is smaller than the expected distance for the samples of size 5. For samples of size 5, several dots are farther from the mean of 54 minutes. The mean of the distance for samples of size 5 would be larger.
Exercises 9–11
Suppose everyone in your class selected a random sample of size 25 from the population of times spent at the gym.
Exercise 9.
What do you think the dot plot of the class’s sample means would look like? Make a sketch using the axis below.
Answer:
Students’ sketches should show dots that have less spread than those in the dot plot for samples of size 15.
For example, students’ dot plots might look like this:
Exercise 10.
Suppose that a statistician plans to estimate the population mean using a sample of size 25. According to your sketch, approximately how far can the statistician expect the sample mean to be from the population mean?
Answer:
We were told in Exercise 7 that the population mean is 53.9. If you calculate the mean of the distances from the population mean (in the same way you did in Exercise 7), the average or expected distance of a sample mean from 53.9 is approximately 3 minutes for a dot plot similar to the one above. This estimate is made by approximating the average distance of each dot from 53.9 or 54. Note: If necessary, make a chart similar to what was suggested in Exercise 7. Using the dot plot, direct students to estimate the distance of each dot from 54 (rounding to the nearest whole number is adequate for this question), add up the distances, and divide by the number of dots.
Exercise 11.
Suppose you have a choice of using a sample of size 5, 15, or 25. Which of the three makes the sampling variability of the sample mean the smallest? Why would you choose the sample size that makes the sampling variability of the sample mean as small as possible?
Answer:
Choosing a sample size of 25 makes the sampling variability of the sample mean the smallest, which is preferable because the sample mean is then more likely to be closer to the population mean than it would be for the smaller sample sizes.
Eureka Math Grade 7 Module 5 Lesson 18 Problem Set Answer Key
Question 1.
The owner of a new coffee shop is keeping track of how much each customer spends (in dollars). One hundred of these amounts are shown in the table below. These amounts will form the population for this question.
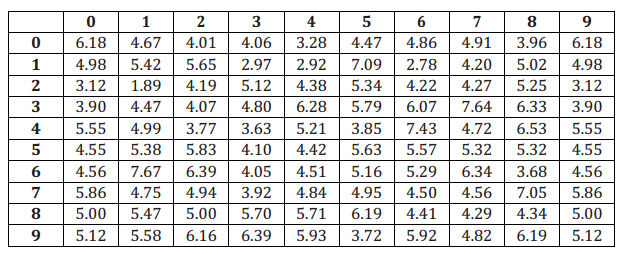
a. Place the table of random digits in front of you. Select a starting point without looking at the page. Then, taking two digits at a time, select a random sample of size 10 from the population above. Write the 10 values in the space below. (For example, suppose you start at the third digit of row four of the random digit table. Taking two digits gives you 19. In the population above, go to the row labeled 1, and move across to the column labeled 9. This observation is 4.98, and that will be the first observation in your sample. Then, continue in the random digit table from the point you reached.)
Answer:
a. For example (starting in the random digit table at the 8 th digit in row 15):
5.12, 5.47, 5.71, 6.18, 4.55, 5.12, 3.63, 5.12, 5.71, 4.34.
Calculate the mean for your sample, showing your work. Round your answer to the nearest thousandth.
\(\frac{5.12+5.47+5.71+6.18+4.55+5.12+3.63+5.12+5.71+4.34}{10}\) = 5.095
Calculate the mean for your sample, showing your work. Round your answer to the nearest thousandth.
Answer:
For example (starting in the random digit table at the 8 th digit in row 15):
5.12, 5.47, 5.71, 6.18, 4.55, 5.12, 3.63, 5.12, 5.71, 4.34.
Calculate the mean for your sample, showing your work. Round your answer to the nearest thousandth.
\(\frac{5.12+5.47+5.71+6.18+4.55+5.12+3.63+5.12+5.71+4.34}{10}\) = 5.095
b. Using the same approach as in part (a), select a random sample of size 20 from the population.
Calculate the mean for your sample of size 20. Round your answer to the nearest thousandth.
Answer:
For example (continuing in the random digit table from the point reached in part (a)):
6.39, 5.58, 4.67, 5.12, 3.90, 3.92, 5.57, 6.34, 5.25, 6.18, 5.71, 6.18, 7.43, 4.06, 4.19, 7.43, 4.34, 4.06, 5.42, 5.42.
Calculate the mean for your sample of size 20. Round your answer to the nearest thousandth.
\(\frac{6.39+\cdots+5.42}{20}\) = 5.358
c. Which of your sample means is likely to be the better estimate of the population mean? Explain your answer in terms of sampling variability.
Answer:
The sample mean from the sample of size 20 is likely to be the better estimate since larger samples result in smaller sampling variability of the sample mean.
Question 2.
Two dot plots are shown below. One of the dot plots shows the values of some sample means from random samples of size 10 from the population given in Problem 1. The other dot plot shows the values of some sample means from random samples of size 20 from the population given in Problem 1.
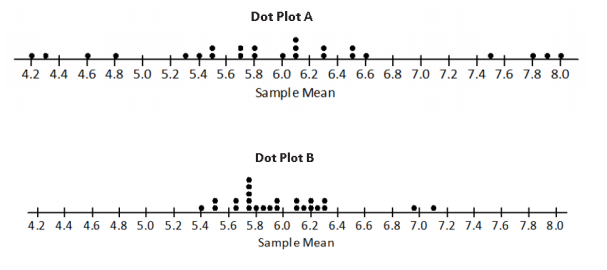
Which dot plot is for sample means from samples of size 10, and which dot plot is for sample means from samples of size 20? Explain your reasoning.
The sample means from samples of size 10 are shown in Dot Plot __________.
The sample means from samples of size 20 are shown in Dot Plot ___________.
Answer:
The sample means from samples of size 10 are shown in Dot Plot A.
The sampling variability is greater than in Dot Plot B.
The sample means from samples of size 20 are shown in Dot Plot B.
The sampling variability is smaller compared to Dot Plot A, which implies that the sample size was greater.
Question 3.
You are going to use a random sample to estimate the mean travel time for getting to school for all the students in your grade. You will select a random sample of students from your grade. Explain why you would like the sampling variability of the sample mean to be small.
Answer:
I would like the sampling variability of the sample mean to be small because then it is likely that my sample mean will be close to the mean time for all students at the school.
Eureka Math Grade 7 Module 5 Lesson 18 Exit Ticket Answer Key
Suppose that you wanted to estimate the mean time per evening spent doing homework for students at your school. You decide to do this by taking a random sample of students from your school. You will calculate the mean time spent doing homework for your sample. You will then use your sample mean as an estimate of the population mean.
Question 1.
The sample mean has sampling variability. Explain what this means.
Answer:
There are many different possible samples of students at my school, and the value of the sample mean varies from sample to sample.
Question 2.
When you are using a sample statistic to estimate a population characteristic, do you want the sampling variability of the sample statistic to be large or small? Explain why.
Answer:
You want the sampling variability of the sample statistic to be small because then you can expect the value of your sample statistic to be close to the value of the population characteristic that you are estimating.
Question 3.
Think about your estimate of the mean time spent doing homework for students at your school. Given a choice of using a sample of size 20 or a sample of size 40, which should you choose? Explain your answer.
Answer:
I would use a sample of size 40 because then the sampling variability of the sample mean would be smaller than it would be for a sample of size 20.