Engage NY Eureka Math 7th Grade Module 5 Lesson 17 Answer Key
Eureka Math Grade 7 Module 5 Lesson 17 Exercise Answer Key
Exercises 1–4
Initially, you will select just five values from the population to form your sample. This is a very small sample size, but it is a good place to start to understand the ideas of this lesson.
Exercise 1.
Use the table of random numbers to select five values from the population of times. What are the five observations in your sample?
Answer:
Make sure students write down these values and understand how they were selected. In the example given, the following observations were selected: 53 min., 63 min., 31 min., 70 min., and 42 min.
Exercise 2.
For the sample that you selected, calculate the sample mean.
Answer:
\(\frac{53+63+31+70+42}{5}\) = 51.8
For the given example, the sample mean is 51.8 min.
Exercise 3.
You selected a random sample and calculated the sample mean in order to estimate the population mean. Do you think that the mean of these five observations is exactly correct for the population mean? Could the population mean be greater than the number you calculated? Could the population mean be less than the number you calculated?
Answer:
Make sure that students see that the value of their sample mean (51.8 minutes in the given example, but students will have different sample means) is not likely to be exactly correct for the population mean. The population mean could be greater or less than the value of the sample mean.
Exercise 4.
In practice, you only take one sample in order to estimate a population characteristic. But, for the purposes of this lesson, suppose you were to take another random sample from the same population of times at the gym. Could the new sample mean be closer to the population mean than the mean of these five observations? Could it be farther from the population mean?
Answer:
Make sure students understand that if they were to take a new random sample, the new sample mean is unlikely to be equal to the value of the sample mean of their first sample. It could be closer to or farther from the population mean.
Exercises 5–7
As a class, you will now investigate sampling variability by taking several samples from the same population. Each sample will have a different sample mean. This variation provides an example of sampling variability.
Exercise 5.
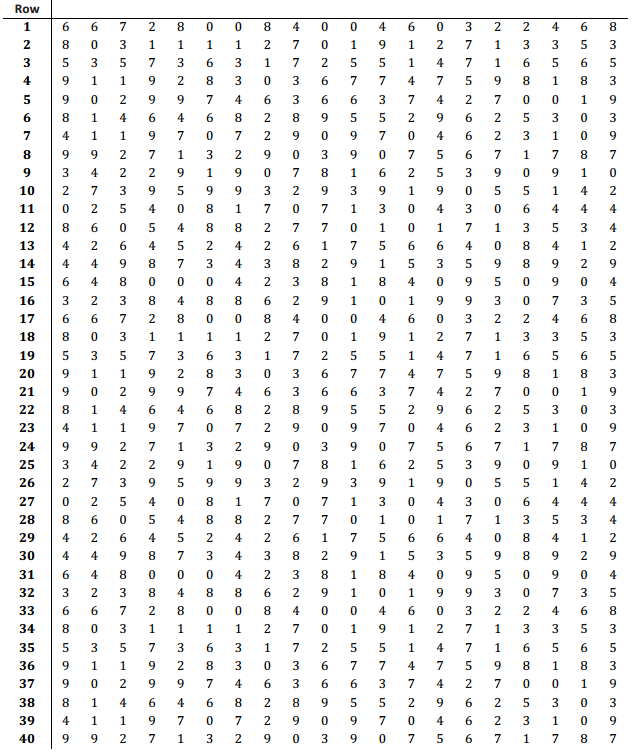
Place the table of random digits in front of you, and without looking at the page, place the eraser end of your pencil somewhere on the table of random numbers. Start using the table of random digits at the number closest to where your eraser touches the paper. This digit and the following two specify which observation from the population tables will be the first observation in your sample. Write this three-digit number and the corresponding data value from the population in the space below.
Answer:
Answers will vary based on the numbers selected.
Exercise 6.
Continue moving to the right in the table of random digits from the place you ended in Exercise 5. Use three digits at a time. Each set of three digits specifies which observation in the population is the next number in your sample. Continue until you have four more observations, and write these four values in the space below.
Answer:
Answers will vary based on the numbers selected.
Exercise 7.
Calculate the mean of the five values that form your sample. Round your answer to the nearest tenth. Show your work and your sample mean in the space below.
Answer:
Answers will vary based on the numbers selected.
Exercises 8–11
You will now use the sample means from Exercise 7 from the entire class to make a dot plot.
Exercise 8.
Write the sample means for everyone in the class in the space below.
Answer:
Answers will vary based on the collected sample means.
Exercise 9.
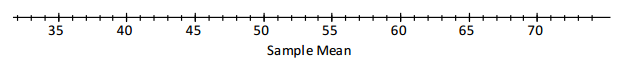
Use all the sample means to make a dot plot using the axis given below. (Remember, if you have repeated or close values, stack the dots one above the other.)
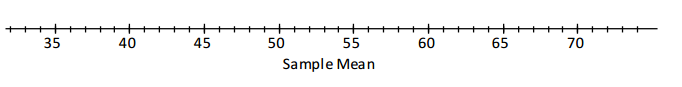
Answer:
Exercise 10.
What do you see in the dot plot that demonstrates sampling variability?
Answer:
Sample response: The dots are spread out, indicating that the sample means are not the same. The results indicate what we discussed as sampling variability. (See the explanation provided at the end of this lesson.)
Exercise 11.
Remember that in practice you only take one sample. (In this lesson, many samples were taken in order to demonstrate the concept of sampling variability.) Suppose that a statistician plans to take a random sample of size 5 from the population of times spent at the gym and that he will use the sample mean as an estimate of the population mean. Approximately how far can the statistician expect the sample mean to be from the population mean?
Population
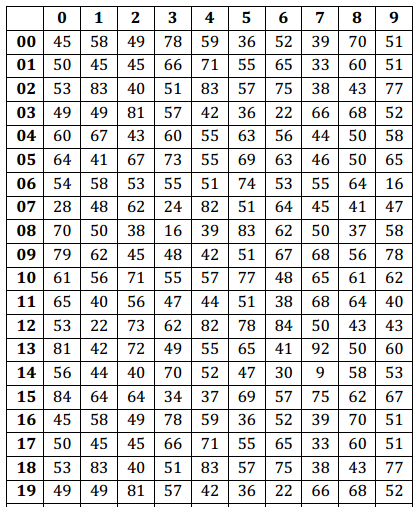
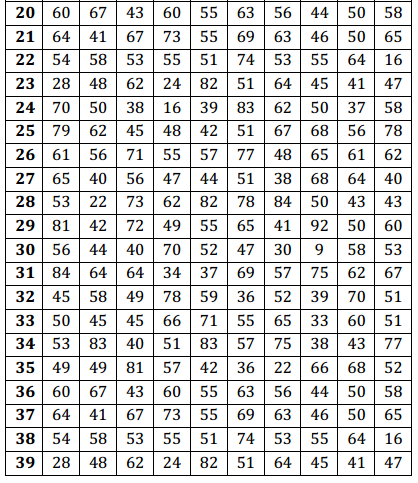
Population (continued)
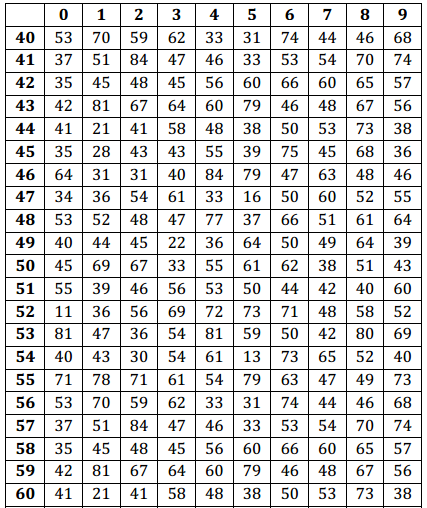
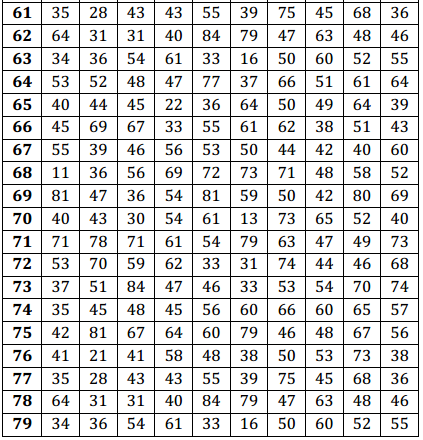
Table of Random Digits
Answer:
Answers will vary. Allow students to speculate as to what the value of the population mean might be and how far a sample mean would be from that value. The distance students indicate are based on the dot plot. Students may indicate the sample mean to be exactly equal to the population and that the distance would be 0.
They may also indicate the sample mean to be one of the dots that is a minimum or a maximum of the distribution and suggest a distance from the minimum or maximum to the center of the distribution. Students should begin to see that the distribution has a center that they suspect is close to the population’s mean.
Eureka Math Grade 7 Module 5 Lesson 17 Problem Set Answer Key
Question 1.
Youself intends to buy a car. He wishes to estimate the mean fuel efficiency (in miles per gallon) of all cars available at this time. Yousef selects a random sample of 10 cars and looks up their fuel efficiencies on the Internet.
The results are shown below.
22 25 29 23 31 29 28 22 23 27
a. Yousef will estimate the mean fuel efficiency of all cars by calculating the mean for his sample. Calculate the sample mean, and record your answer. (Be sure to show your work.)
Answer:
\(\frac{22+25+29+23+31+29+28+22+23+27}{10}\) = 25.9
b. In practice, you only take one sample to estimate a population characteristic. However, if Yousef were to take another random sample of 10 cars from the same population, would he likely get the same value for the sample mean?
Answer:
No. It is not likely that Yousef would get the same value for the sample mean.
c. What if Yousef were to take many random samples of 10 cars? Would all of the sample means be the same?
Answer:
No. He could get many different values of the sample mean.
d. Using this example, explain what sampling variability means.
Answer:
The fact that the sample mean varies from sample to sample is an example of sampling variability.
Question 2.
Think about the mean number of siblings (brothers and sisters) for all students at your school.
a. What do you think is the approximate value of the mean number of siblings for the population of all students at your school?
Answer:
Answers will vary.
b. How could you find a better estimate of this population mean?
Answer:
I could take a random sample of students, ask the students in my sample how many siblings they have, and find the mean for my sample.
c. Suppose that you have now selected a random sample of students from your school. You have asked all of the students in your sample how many siblings they have. How will you calculate the sample mean?
Answer:
I will add up all of the values in the sample and divide by the number of students in the sample.
d. If you had taken a different sample, would the sample mean have taken the same value?
Answer:
No. A different sample would generally produce a different value of the sample mean. It is possible but unlikely that the sample mean for a different sample would have the same mean.
e. There are many different samples of students that you could have selected. These samples produce many different possible sample means. What is the phrase used for this concept?
Answer:
Sampling variability
f. Does the phrase you gave in part (e) apply only to sample means?
Answer:
No. The concept of sampling variability applies to any sample statistic.
Eureka Math Grade 7 Module 5 Lesson 17 Exit Ticket Answer Key
Suppose that you want to estimate the mean time per evening students at your school spend doing homework. You will do this using a random sample of 30 students.
Question 1.
Suppose that you have a list of all the students at your school. The students are numbered 1,2,3,…. One way to select the random sample of students is to use the random digit table from today’s class, taking three digits at a time. If you start at the third digit of Row 9, what is the number of the first student you would include in your sample?
Answer:
The first student in the sample would be student number 229.
Question 2.
Suppose that you have now selected your random sample and that you have asked the students how long they spend doing homework each evening. How will you use these results to estimate the mean time spent doing homework for all students?
Answer:
I would calculate the mean time spent doing homework for the students in my sample.
Question 3.
Explain what is meant by sampling variability in this context.
Answer:
Different samples of students would result in different values of the sample mean. This is sampling variability of the sample mean.